
Figures & data
Figure 1. Randomized trial flow diagram, including enrollment, intervention allocation, follow up and analysis.
Table 1. Patient characteristics among the three groups.
Figure 2. Intraoperative (A) MAP, (B) HR and postoperative (C) MAP, (D) HR among the three groups.
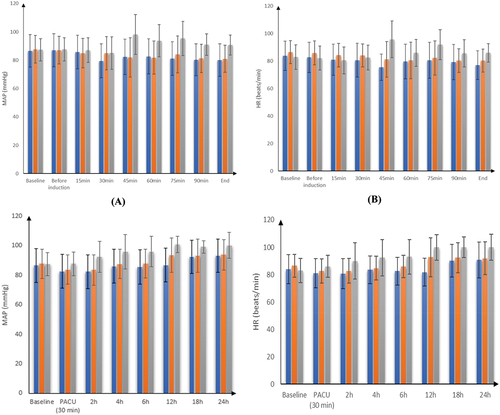
Table 2. Time of first analgesic requirement (h), total morphine consumption (mg), cortisol levels, random blood sugar and patient satisfaction among the three group.
Figure 3. VAS among the three group.
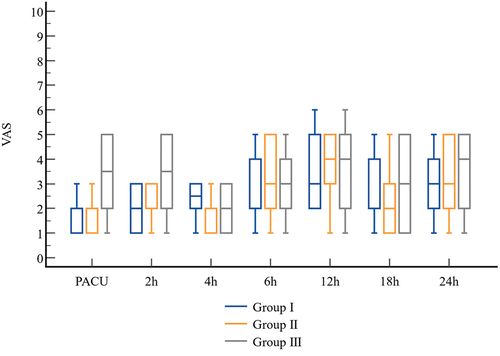
Table 3. Occurrence of chronic pain at 3 and 6 months after surgery, and adverse events among the three group.