Figures & data
Figure 1. Consort flow chart of the two studied groups.
Group E: Erector Spinae Block (ESPB); Group P: Modified pectoralis nerve block plus transversus thoracic plane block (PECS-II-TTP);.
Figure 2. Ultrasonographic visualization of different study blocks.
A: Erector spinae plane block (ESPB). B: Modified pectoralis nerve block (PECS II block). C: Transverses thoracic plane block (TTP).
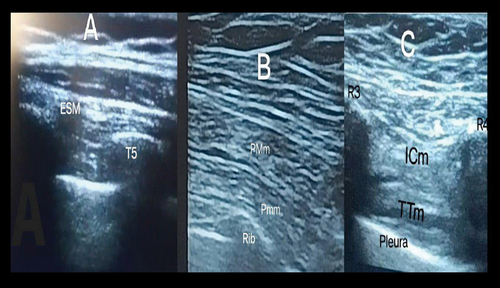
Table 1. Demographic and baseline data, operative time, fluid intake, procedure-related complications (hypotension), ephedrine dose, and post-operative complications in the two studied groups.
Table 2. Recovery time, morphine consumption, time to first analgesia, and IL6 levels among the studied groups.
Figure 3. Numeric rating scale (NRS) in the two studied groups.
Group E: Erector Spinae Block (ESPB); Group P: Modified pectoralis nerve block plus transversus thoracic plane block (PECS-II-TTP);.
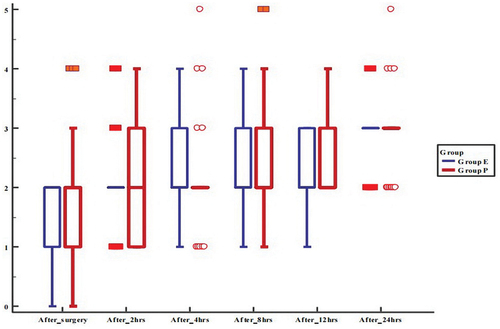
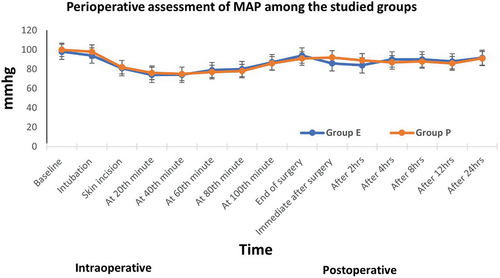
Figure 4. Perioperative assessment of Mean arterial blood pressure (MAP) changes in the two studied groups.
Group E: Erector Spinae Block (ESPB); Group P: Modified pectoralis nerve block plus transversus thoracic plane block (PECS-II-TTP);.