Figures & data
Figure 1. Enrollment.
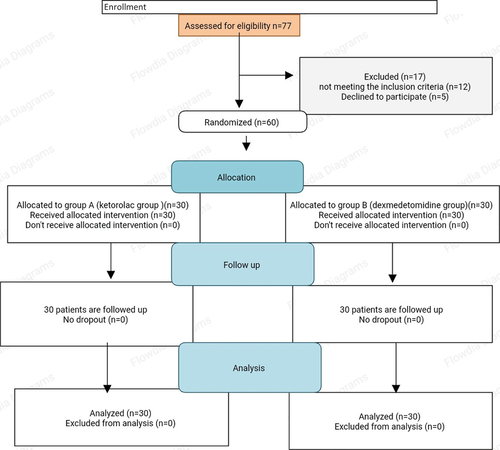
Table 1. Baseline data of the studied groups.
Figure 2. Change in postoperative FLACC pain scale at different times in both groups. FLACC: The Face, Legs, Activity, Cry, Consolability.
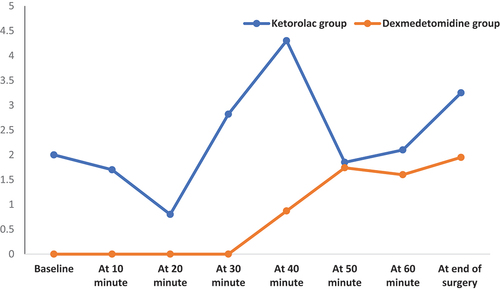
Figure 3. Change in postoperative RSS at different times in both groups. RSS: Ramsay sedation score.
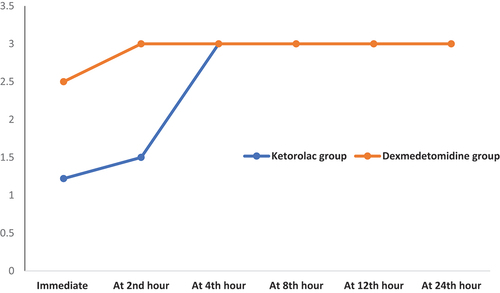
Table 2. Time to 1st analgesia request and total analgesia consumption.
Table 3. Postoperative FLACC pain score at different times in both groups.
Table 4. RSS and frequency of emergency agitation in both groups.
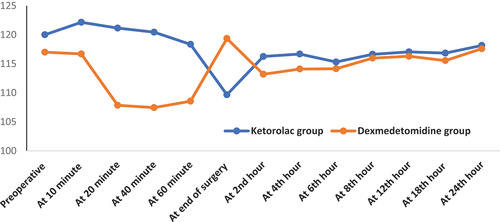
Figure 4. Change in heart rate at different times in both groups.