Figures & data
Table 1. Descriptive statistics for the patients in the two groups.
Table 2. Average preoperative hemodynamic data.
Table 3. Average intraoperative hemodynamics data.
Table 4. Percent of the Change from the baseline among the Somatosensory evoked potential andmotor evoked potential among the two groups.
Table 5. Comparing the need for intraoperative and postoperative analgesics in both groups.
Table 6. Severity of pain among the two groups at different times postoperatively.
Figure 1. The total dose of Propofol in mg. used in the two groups, blue line for Group E and the orange for group C, the results are represented as mean ± SD.
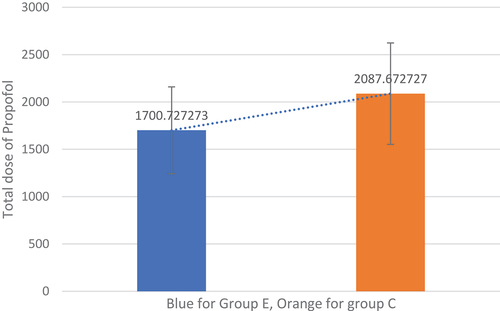
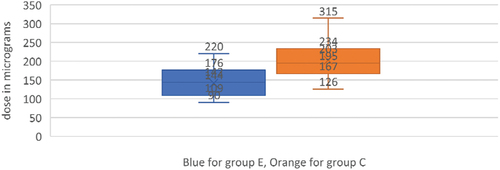
Figure 2. The median and interquartile range for the total dose of Dexmedetomidine in microgram.Microgram.The results are presented as median, interquartile range, minimum and maximum).