618
Views
12
CrossRef citations to date
0
Altmetric
ECOLOGY & ETHOLOGY

The epibiontic assemblage of Geryon longipes (Crustacea: Decapoda: Geryonidae) from the Southern Adriatic Sea

, , , , &
Pages 29-35 | Published online: 06 Dec 2007

Figures & data

Figure 1. Portions of the crab exoskeleton. Carapace: A, anterior dorsal surface; B, posterior dorsal surface; C, antero‐lateral ventral surface; D, sternum and abdomen; E, junction between abdomen and carapace. The black bar shows the distance between base of posterior anterolateral spines. Chelipeds: (1) chela, articulation of mobile finger; walking legs: (2) proximal segments coxa/ischium/basis; (3) central segments carpus/merus; (4) distal segments propodus/dactylus.
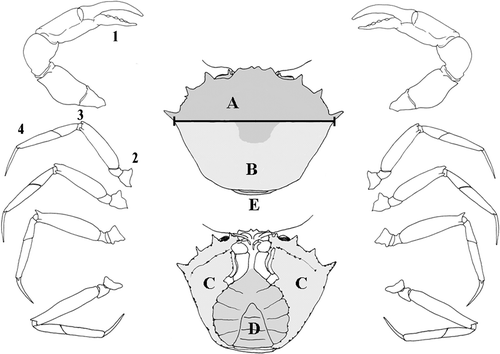
Figure 1. Portions of the crab exoskeleton. Carapace: A, anterior dorsal surface; B, posterior dorsal surface; C, antero‐lateral ventral surface; D, sternum and abdomen; E, junction between abdomen and carapace. The black bar shows the distance between base of posterior anterolateral spines. Chelipeds: (1) chela, articulation of mobile finger; walking legs: (2) proximal segments coxa/ischium/basis; (3) central segments carpus/merus; (4) distal segments propodus/dactylus.

Figure 2. Leuckartiara cf. octona: A, colony; B, hydranth; C, Pseudohydrotheca. Hydractinia sp.: D, colony; E, hydranth and medusa buds. F, Triticella flava. G, Arachnoidea sp. Scale bars: A, D, G, 500 µm; B, C, E, F, 200 µm.
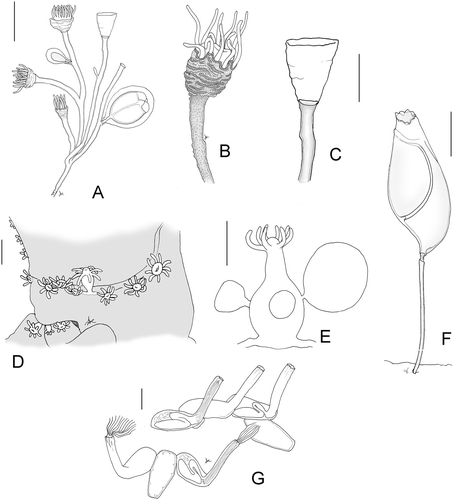
Figure 2. Leuckartiara cf. octona: A, colony; B, hydranth; C, Pseudohydrotheca. Hydractinia sp.: D, colony; E, hydranth and medusa buds. F, Triticella flava. G, Arachnoidea sp. Scale bars: A, D, G, 500 µm; B, C, E, F, 200 µm.

Figure 3. Average number(±SE) of each epibiont in relation to the size class of the crabs.

Figure 3. Average number(±SE) of each epibiont in relation to the size class of the crabs.

Figure 4. Average percentage(±SE) of epibionts in each portion of the crab exoskeleton. (A) Leuckartiara cf. octona. Epibionts are concentrated on junctions (arrows). (B) Triticella flava. The legend of the crab portions is explained in Material and methods. In the drawings, the parts colonised by the epibionts are showed in grey.
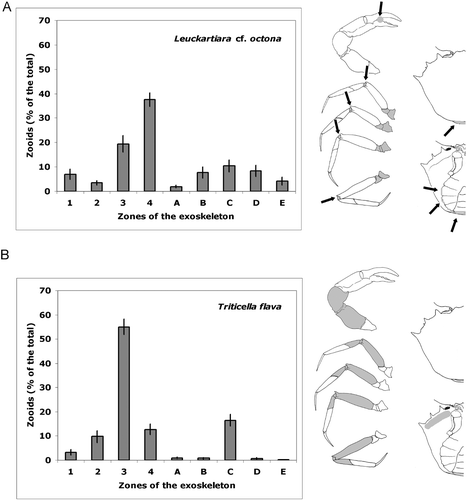
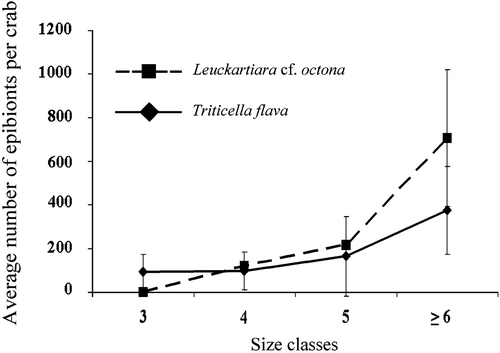
Figure 4. Average percentage(±SE) of epibionts in each portion of the crab exoskeleton. (A) Leuckartiara cf. octona. Epibionts are concentrated on junctions (arrows). (B) Triticella flava. The legend of the crab portions is explained in Material and methods. In the drawings, the parts colonised by the epibionts are showed in grey.
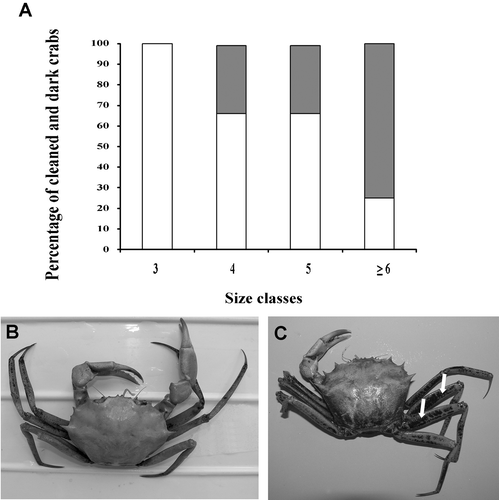
Figure 5. A, Percent of crabs with exoskeleton partly covered with manganese oxide deposits (dark bars) and with clean exoskeleton (white bars) in each size class. B, Example of a clean crab and of one with a manganese oxide cover, especially on the legs (arrows).

Figure 5. A, Percent of crabs with exoskeleton partly covered with manganese oxide deposits (dark bars) and with clean exoskeleton (white bars) in each size class. B, Example of a clean crab and of one with a manganese oxide cover, especially on the legs (arrows).

Reprints and Corporate Permissions

Please note: Selecting permissions does not provide access to the full text of the article, please see our help page How do I view content?

To request a reprint or corporate permissions for this article, please click on the relevant link below:

Academic Permissions

Please note: Selecting permissions does not provide access to the full text of the article, please see our help page How do I view content?

Obtain permissions instantly via Rightslink by clicking on the button below:

If you are unable to obtain permissions via Rightslink, please complete and submit this Permissions form. For more information, please visit our Permissions help page.