Figures & data
Figure 1 The profiles of temperature and salinity typical for winter (1) and summer (2) in the southwestern Black Sea (a, b), in the northeastern Marmara Sea near the Prince Islands (c, d) and in the Izmit Bay (e, f).
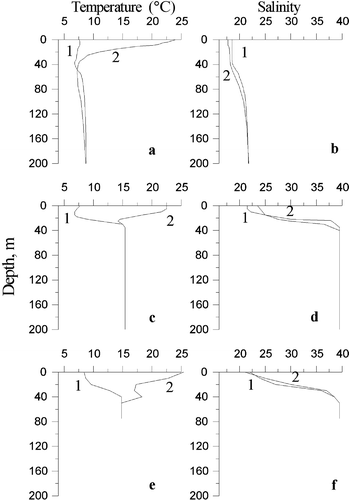
Figure 2 Location of sampling stations.
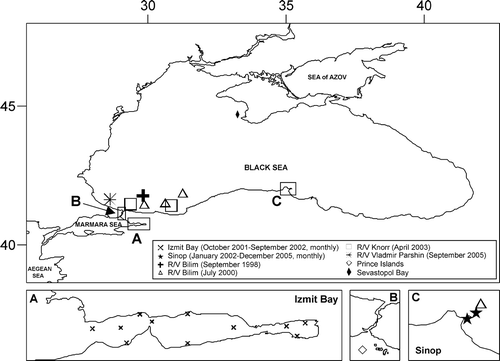
Figure 3 Abundance (ind m−2) of Calanus euxinus in the Black Sea near Sinop at the permanent inshore (○) and offshore (•) stations during 2002 (a), 2003 (b), 2004 (c) and 2005 (d) years, in the southwestern part of the Black Sea (▪) in April 2003, June 2001, July 2000 and October 2005, in the Marmara Sea (⧫) near the Prince Islands in February 2007, April 2005, June 2001, July 2007, October 2000, 2005 and December 2006, 2007, and in Izmit Bay (![]()
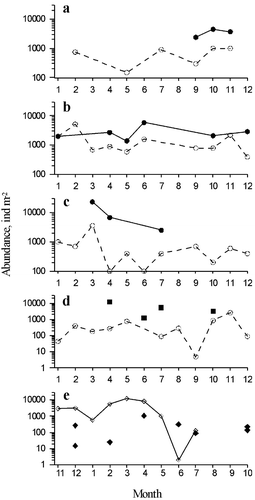
Figure 4 Molting phase frequency distribution in Calanus euxinus copepodites V during sampling in the southwestern Black Sea (a) and in the Marmara Sea near the Prince Islands (b) and in Izmit Bay (c). 1, postmolt; 2, late postmolt; 3, intermolt; 4, early premolt; 5, premolt.
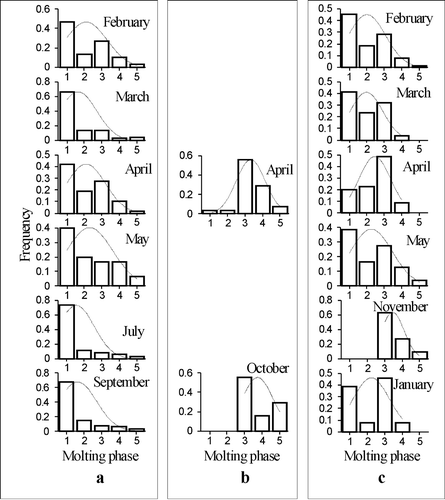
Table I. Diameter of eggs (D) and prosome length (Lpr) from copepodites 1 (CI) to adults females (CVIF) and males (CVIM) in Calanus euxinus collected in the deep water near Sinop and in the south‐western part of the Black Sea during 2000–2005, in the shallow water near Sevastopol in 2002 and reared in the laboratory, and from the Marmara Sea near the Prince Islands (2000–2005) and in Izmit Bay (2001–2002). G1–G3 size groups, determined according to frequency distribution of the prosome length in different stages of Calanus euxinus.
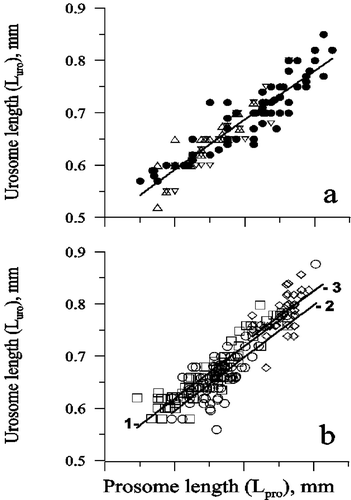
Figure 5 Urosome length plotted against prosome length in Calanus euxinus females (a) collected in the Black Sea (•) in deep and shallow water and reared in the laboratory, in the Marmara Sea (▵) and Izmit Bay (▿) during winter–spring period, and Calanus helgolandicus females (b) from the North Atlantic (□, 1), Mediterranean Sea (○, 2) and Black Sea (⋄, 3) according to the results of Fleminger and Hulsemann (Citation1987).