Figures & data
Figure 1. Superoxide dismutase activity in different age groups of Eudrilus eugeniae. The values are mean ± SE of five animals per age group. Significance between group means is represented in uppercase. Those not sharing the same letters are significantly different at P< 0.05.
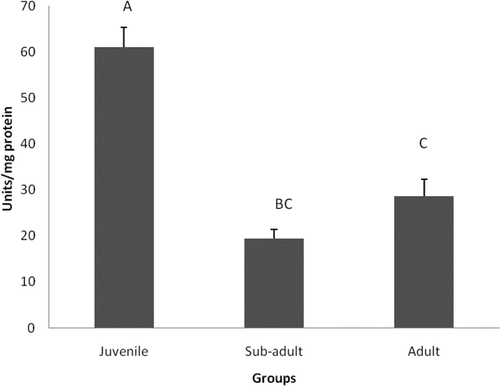
Figure 2. Catalase activity in different age groups of Eudrilus eugeniae. The values are mean ± SE of five animals per age group. Significance between group means is represented in uppercase. Those not sharing the same letters are significantly different at P< 0.05.
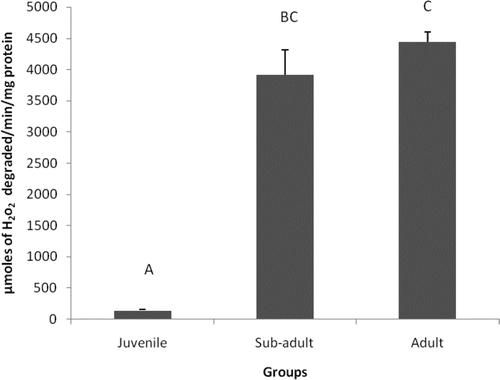
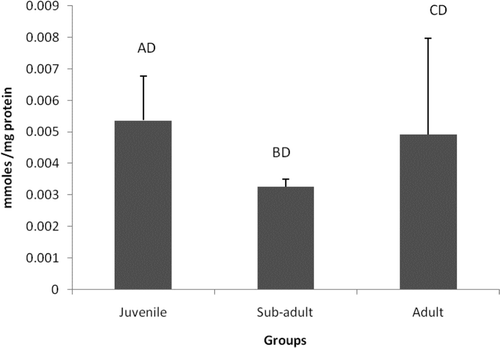
Figure 3. Levels of MDA content in different age groups of Eudrilus eugeniae. The values are mean ± SE of five animals per age group. Significance between group means is represented in uppercase. Those not showing the same letters are significantly different at P < 0.05.
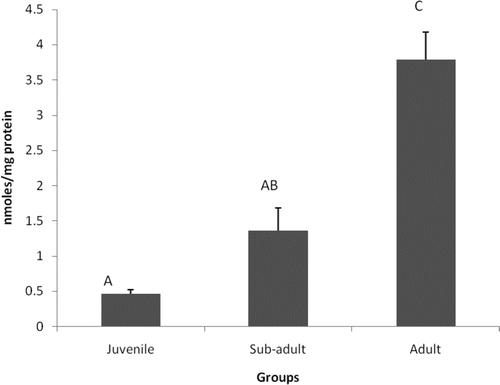
Figure 4. Levels of protein carbonyl content in different age groups of Eudrilus eugeniae. The values are mean ± SE of five animals per age group. Significance between group means is represented in uppercase. Those not showing the same letters are significantly different at P < 0.05.