Figures & data
Figure 1. (A). Left side view of an urohyal bone in Gerreidae fish. Terminology of urohyal as follows: Ha = hypohyal attachment; Ba = basibranchial attachment; Ve = ventral extension; De = dorsal extension; Dp = dorsal plate; Pde = postero-dorsal edge; Rb = radial band; Lp = lateral plate; Pe = posterior edge; Ve = ventral edge; Vp = ventral plate; Co = condyle (modified from Kusaka Citation1974). Circle and cross indicating the orientation of urohyal on the body plan: D = dorsal; V = ventral; A = anterior; P = posterior. (B). Urohyal bone position during closure (I) and opening (II) of the oral cavity, exemplified in Eugerres lineatus (Cuvier, 1830), the striped mojarra. Note that only for illustration purposes the bone is depicted over the opercle, disconnected from basibranchial (anterdorsal) and hypohyals (ventral).
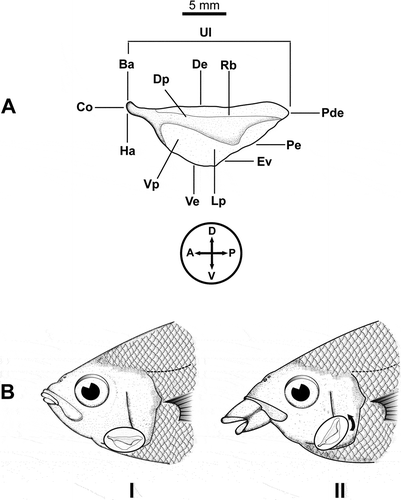
Table I. Number of samples (n), standard length range (SL, mm) and mean (m SL) of Gerreidae fish collected and used in the urohyal morphology analysis.
Table II. Kolmogorov-Smirnov (K-S) test of normality at the 95% confidence level for the urohyal raw untransformed data (RUD), and standardized measurements (SM). Perimeter was transformed by the Box-Cox function. *Not normally distributed.
Figure 2. Morphology of the urohyal bone in Gerreidae species. (Da) Diapterus auratus, (Db) D. brevirostris, (El) Eugerres lineatus, (Ep) E. plumieri, (Ee) Eucinostomus entomelas and (Gc) Gerres cinereus. Scale bars: for urohyals, 0.5 mm, and 1 cm for fish.
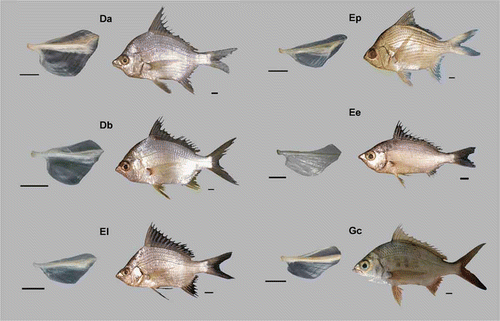
Figure 3. Box plots comparing Feret maximum (Fmx, i.e. the size estimator) for the urohyal bone of six Gerreidae species (raw untransformed data): (Da) Diapterus auratus, (Db) D. brevirostris, (El) Eugerres lineatus, (Ep) E. plumieri, (Ee) Eucinostomus entomelas and (Gc) Gerres cinereus, showing the mean (+), median (dashed lines), quartiles, standard deviations (SDs; grey boxes) and range values (minimum and maximum). Sample sizes are given in (● and * indicate, respectively, individual values greater than 1.5 and 3 times the interquartile range from the nearest quartile).
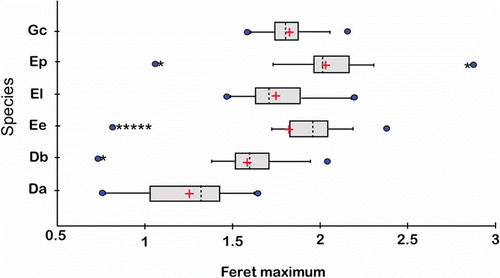
Table III. Classification matrix as a result of discriminant function analysis testing for differences between analyzed Gerreidae species based on 13 urohyal shape and size descriptors. (Da) Diapterus auratus, (Db) D. brevirostris, (El) Eugerres lineatus, (Ep) E. plumieri, (Ee) Eucinostomus entomelas and (Gc) Gerres cinereus.
Figure 4. Scatter plots of first (F1) and second (F2) discriminant functions. Discriminant function analysis (DFA) using 13 urohyal shape and size descriptors of the six species of Gerreidae. The first discriminant axis (F1) explains 71.73% and the second axis (F2) 15.02%. (Da) Diapterus auratus, (Db) D. brevirostris, (El) Eugerres lineatus, (Ep) E. plumieri, (Ee) Eucinostomus entomelas and (Gc) Gerres cinereus.
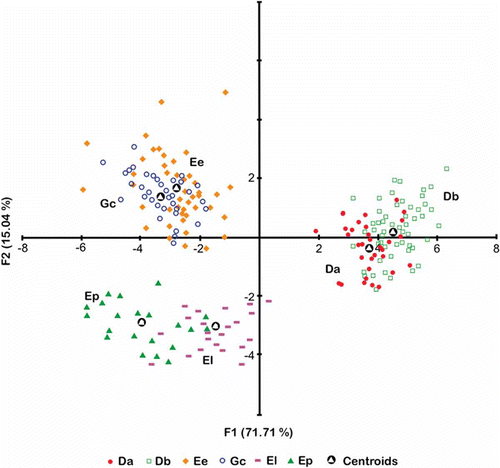
Table IV. Mahalanobis distances between groups (above the diagonal) and p value of the F test (below the diagonal). Da: Diapterus auratus, Db: D. brevirostris, Ee: Eucinostomus entomelas, El: Eugerres lineatus, Ep: E. plumieri and Gc: Gerres cinereus.
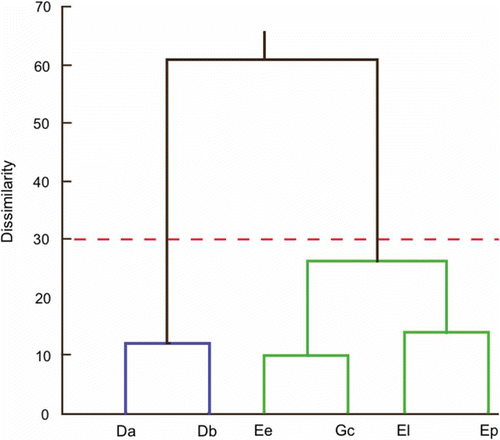
Figure 5. Phenogram indicating the phenotypic relationship of the urohyal morphology (shape and size measurements) for Gerreidae species: (Da) Diapterus auratus, (Db) D. brevirostris, (El) Eugerres lineatus, (Ep) E. plumieri, (Ee) Eucinostomus entomelas and (Gc) Gerres cinereus. Dissimilarity based on the Euclidian distance of Mahalanobis distance values, grouping by hierarchical cluster analysis (UPGMA).
