Figures & data
Table I. Measurements of proximal tibial metaphyseal cancellous bone.
Table II. Static- and dynamic-parameter formulas.
Figure 1. (a) Representative fluorescence micrographs of G-Int.Wi on PTM (undecalcified sections, 8 μm, 10×). 1M: 1 month old, 3M: 3 months old, 6M: 6 months old, 14M: 14 months old. Arrows point to interlabel width after fluorochrome labeling with tetracycline hydrochloride and calcein. The interlabel width in the growth plate for 1-month-old rats was obviously wider than that for other groups, and it declined progressively with increasing age and was narrowest for 14-month-olds. The interlabel width in the growth plate was used to determine LGR. Quantitative measurements of LGR are shown in Figure 1b. (b) Changes of LGR in different ages rats. Data are expressed as means ± SD (n = 6) in each group. LGR was significantly increased in 1- and 3-month-old rats vs. 6- and 14-month-old rats, respectively, and with no differences for 6-month-old rats versus 14-month-old rats. Vs. 14-month-old,*P < 0.01; vs. 6-month-old, ▵P < 0.01, Student’s t-test. PTM, the proximal tibial metaphyses; LGR, longitudinal growth rate; G-Int.Wi, interlabel width in growth plate; 1M: 1-month-old, 3M: 3-month-old, 6M: 6-month-old, 14M: 14-month-old.
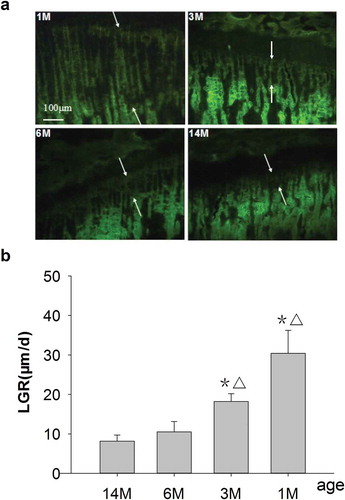
Figure 2. (a) Representative single-fluorescence micrographs of PTM in different ages rats (undecalcified sections, 8 μm, 20×). 1M: 1 month old, 3M: 3 months old, 6M: 6 months old, 14M: 14 months old. The clear and abundant single fluorescence could be seen in 1- and 3-month-old rats. There was less single fluorescence for 6-month-old rats and the minimum for 14-month-old rats, compared with 1- and 3-month-old rats. Arrows point to single fluorescence after fluorochrome labeling with tetracycline hydrochloride and calcein. Quantitative measurements of single fluorescence are shown in Figure 2b. (b) Changes of %L.Pm in rats of different ages. Data are expressed as means ± SD (n = 6) in each group. There were no significant differences in %L.Pm for 1-month-old rats vs. 6-month-old rats; however, this was significantly increased vs. 14-month-old rats, and significantly increased for 3-month-old vs. 6- and 14-month-old rats, respectively. Furthermore, there were no differences in %L.Pm for 6-month-old rats vs. 14-month-old rats. Vs. 14-month-old, ◊P < 0.05, ◊◊P < 0.01; vs. 6-month-old, #P < 0.05, Student’s t-test. PTM, the proximal tibial metaphyses; %L.Pm, percent labeled peri meter; 1M: 1-month-old, 3M: 3-month-old, 6M: 6-month-old, 14M: 14-month-old.
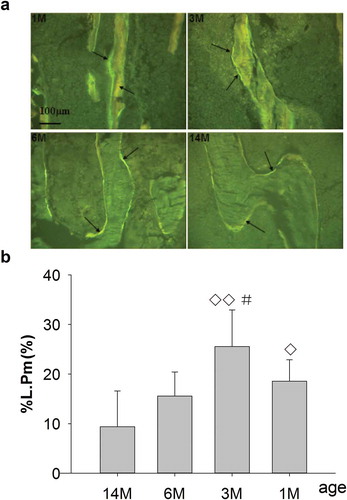
Figure 3. (a) Representative double-fluorescence micrographs of PTM in rats of different ages (undecalcified sections, 8 μm, 20×). 1M: 1 month old, 3M: 3 months old, 6M: 6 months old, 14M: 14 months old. A wider and longer double-fluorescence interval as well as an obvious yellow and green fluorescent strip could be seen in both 1- and 3-month-old rats, and these were narrower and shorter for 6-month-old rats and narrowest and shortest for 14-month-old rats. Arrows point to double fluorescence after fluorochrome labeling with tetracycline hydrochloride and calcein. Quantitative measurements of double fluorescence are shown in Figure 3b. (b) Changes of MAR in rats of different ages. Data are expressed as means ± SD (n = 6) in each group. MAR was significantly increased in 1- and 3-month-old rats vs. 6- and 14-month-old rats, respectively, and there were no differences for 6-month-old rats vs. 14-month-old rats. Vs. 14-month-old, *P < 0.01; vs. 6-month-old, ▵P < 0.01, Student’s t-test. PTM, the proximal tibial metaphyses; MAR, mineral apposition rate; 1M: 1-month-old, 3M: 3-month-old, 6M: 6-month-old, 14M: 14-month-old.
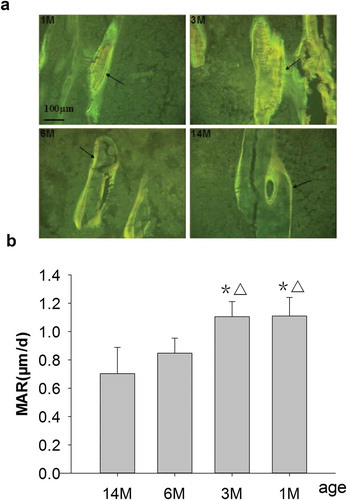
Figure 4. Changes in bone formation, including BFR/BS, BFR/BV, BFR/TV, on PTM in rats of different ages. 1M: 1 month old, 3M: 3 months old, 6M: 6 months old, 14M: 14 months old. (a) Changes of BFR/BS on PTM. (b) Changes of BFR/BV on PTM. (c) Changes of BFR/TV on PTM. BFR/BS and BFR/BV, which peaked for 3-month-old rats, were significantly increased in 1- and 3-month-old rats compared with 6- and 14-month-old rats, respectively. Also, BFR/TV were significantly increased for 1- and 3-month-old rats compared to 14-month-old rats, whereas there were no differences compared to 6-month-old rats, respectively. Data are expressed as means ± SD (n = 6) in each group. Vs. 14-month-old, ◊P < 0.05, ◊◊ P < 0.01; vs. 6-month-old, #P < 0.05, ##P < 0.01, Student’s t-test. PTM, the proximal tibial metaphyses; bone formation rate per unit of bone surface (BFR/BS), per unit of bone volume (BFR/BV) and per unit of tissue volume (BFR/TV). 1M: 1-month-old, 3M: 3-month-old, 6M: 6-month-old, 14M: 14-month-old.
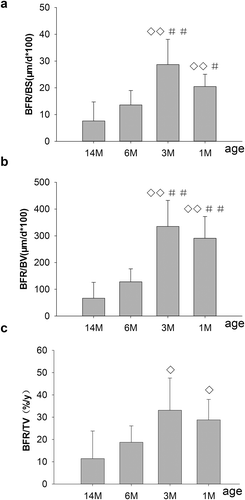
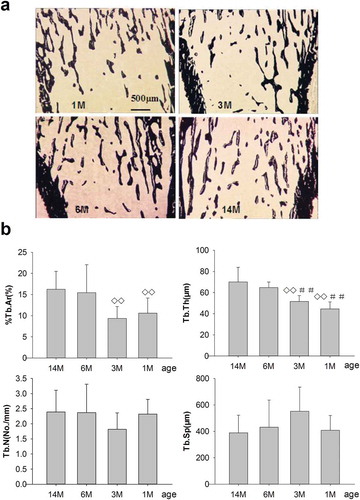
Figure 5. (a) Effects of bone structure and trabecular mass on PTM in rats of different ages. 1M: 1 month old, 3M: 3 months old, 6M: 6 months old, 14M: 14 months old. Slender and interlacing trabeculae were found in 1- and 3-month-old rats. Cancellous bone mass was increased and trabeculae were thickened in 6-month-old rats compared with 1- and 3-month-old rats. Meanwhile, slight increases in cancellous bone mass were seen for 14-month-old rats compared to 6-month-old rats (silver nitrate stain, 4×; trabecular in black stain). Quantitative measurements of static parameters are shown in . (b) Static parameters of %Tb.Ar, Tb.Th, Tb.N and Tb.Sp, on the proximal tibia in rats of different ages. Data are expressed as means ± SD (n = 6) in each group. %Tb.Ar, percent trabecular area; Tb.Th, trabecular thickness; Tb.N, trabecular number; Tb.Sp, trabecular separation. %Tb.Ar, Tb.Th and Tb.N increased progressively, whereas Tb.Sp reduced gradually with aging. Vs. 14-month-old, ◊◊ P < 0.01; vs. 6-month-old, ##P < 0.01, Student’s t-test. PTM, the proximal tibial metaphyses; Tb.Ar, trabecular area; Tb.Th, trabecular thickness; Tb.N, trabecular number; Tb.Sp, trabecular separation. 1M: 1-month-old, 3M: 3-month-old, 6M: 6-month-old, 14M: 14-month-old.