Figures & data
Table I. QRFPR sequences used for phylogeny, and their EMBL/GenBank accession numbers.
Table II. Marginal likelihood values in each of the two independent runs, and the resulting mean values for each of the tested models using the stepping-stone method. Compound Poisson Process (CPP), Thorne–Kishino 2002 (TK02) and Independent Gamma Rates (IGR) model.
Figure 1. Multiple alignment of QRFPR amino acid sequences from different fish species. The grey background alignment regions refer to the TMDs (Transmembrane Domains). Boxed letters refer to the amino acids that play a crucial role in G protein coupling and receptor activation. The disulphide bridge between the two C (Cysteine) residues located in the first and second extracellular loops is indicated by “B”. The letters marked by a black background refer to the positively selected amino acid sites. The symbols at the bottom of the QRFPR sequences correspond to the definitions of the T-coffee program: (*) fully conserved; (:) highly conserved; (.) conserved substitution.
Figure 2. Phylogenetic relationships among different organisms QRFPRs reconstructed on the basis of cDNA coding region sequences and using both methods: BI (Bayesian Inference) (arithmetic mean = −22,234.94; harmonic mean = −22,263.61) and ML (Maximum Likelihood) (arithmetic mean = −22,133.8). Bayesian posterior probability (first number value) and bootstrap values higher than 50% are indicated on each node, respectively. The scale for branch length (0.2 substitution/site) is shown below the tree.
Figure 3. Phylogenetic relationships among different organisms’ QRFPRs reconstructed on the basis of amino acid sequences and using both methods: BI (Bayesian Inference) (arithmetic mean = −10,508.75; harmonic mean = −10,545.58) and ML (Maximum Likelihood) (arithmetic mean = −10,438.4). Bayesian posterior probability (first number value) and bootstrap values higher than 50% are indicated on each node, respectively. The scale for branch length (0.3 substitution/site) is shown below the tree.
Table III. Positively selected codon sites identified by using Mixed Effects Model of Evolution (MEME) and Fast Unconstrained Bayesian AppRoximation (FUBAR), and their calculated statistics. dN – number of nonsynonymous substitutions for site and dS – number of synonymous substitutions for site, their difference must be a positive value in order to have positive selection at a given site; Posterior Pr. – posterior probability is a measure of the probability of having ω = dN/dS > 1 at a given site; p-value – the number of false positive tests.
Table IV. Conserved and altered biochemical properties, which are driving amino acid substitutions in the fish QRFPR molecular evolution. These PRIME (property-informed models of evolution) analyses were based on Conant–Stadler properties and the results were statistically significant for p-values < 0.05. α is a measure of the importance of the alteration or conservation; for lower (negative) α values, the level of conservation of the corresponding property is higher at a given site and for higher (positive) values of α value, the alteration of the corresponding property is more radical at a given site. Altered properties results are shown on a dark grey background, while conserved properties results are shown on a light grey background.
Table V. Conserved and altered biochemical properties which are driving amino acid substitutions in the fish QRFPR molecular evolution. These PRIME (property-informed models of evolution) analyses were based on Atchley properties and the results were statistically significant for p-values < 0.05. Altered properties results are shown on a dark grey background, while conserved properties results are shown on a light grey background.
Figure 4. Importance plot of the altered and conserved properties at different codon sites, identified by PRIME (property-informed models of evolution) analyses based on Conant–Stadler properties. The colour of each of the circles refers to the colour of a specific biochemical property shown on the bottom of the graphic. For higher vertical distance from 0, the property alterations or conservations become more radical. The altered properties of the positively selected sites are indicated by empty circles. In the online document you can find the colored version of this figure.
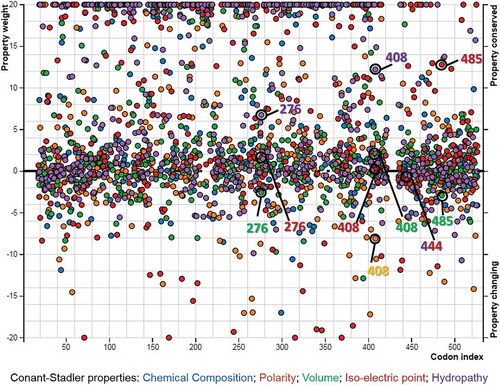
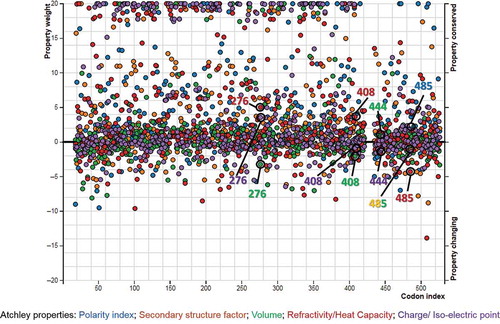
Figure 5. Importance plot of the altered and conserved properties at different codon sites, identified by PRIME (property-informed models of evolution) analyses based on Atchley properties. The altered and conserved properties of the positively selected sites are indicated by empty circles. In the online document you can find the colored version of this figure.