Figures & data
Figure 1. Mean temperature of each month at Shennongjia Nature Reserve.
Table I. Numbers of studied individuals and samples used for this analysis.
Table II. Overall ranks of male and female snub-nosed monkeys, using behavior classifications (dominance index, DI) and fecal glucocorticoid metabolite (FGM) levels.
Figure 2. Relationship of behavioral ranks vs fecal glucocorticoid metabolite (FGM), and FGM vs behavioral ranks, as determined by TreeNet.
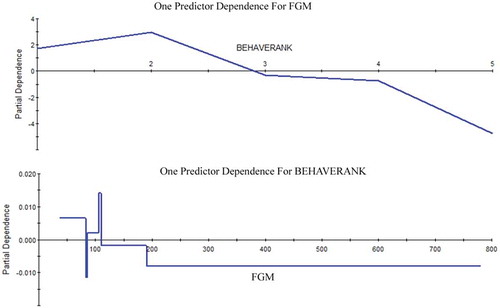
Figure 3. Spearman rho2; presented as varclust.
Table III. Climatic seasonal order of the fecal glucocorticoid metabolite (FGM) levels for dominant males and females.
Figure 4. Behavioral ranks by male and female individuals.
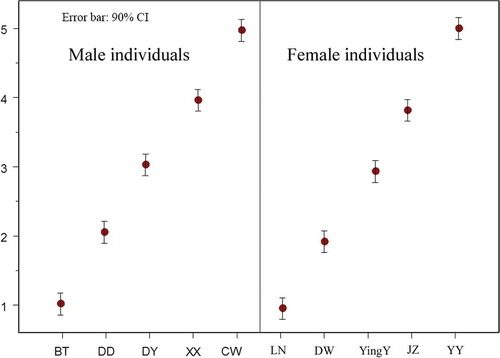
Figure 5. Boxplots of fecal glucocorticoid metabolite (FMG) levels by individuals (mean, 95% confidence intervals notches, 75% quantile boxes and outliers are shown).
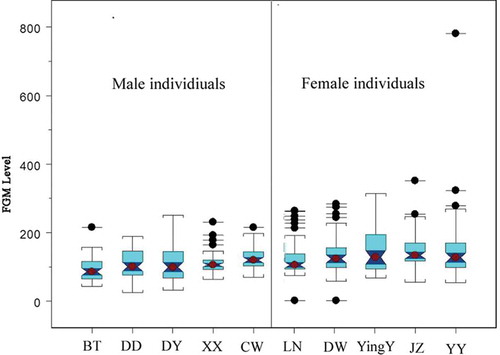
Table IV. Importance ranks of the fecal glucocorticoid metabolite (FGM) variables of males/females as well as by male and by female.
Table V. Two-way interactions as provided by TreeNet (Friedman Citation1999, Citation2002).
Table VI. Levels for collaborative vs aggressive behavior.
Figure 6. Seasonal changes of the fecal glucocorticoid metabolite (FGM) levels for males.
Figure 7. Seasonal changes of the fecal glucocorticoid metabolite (FGM) levels for females.