Figures & data
Figure 1. Geographical position of the investigated grassland ecosystems.
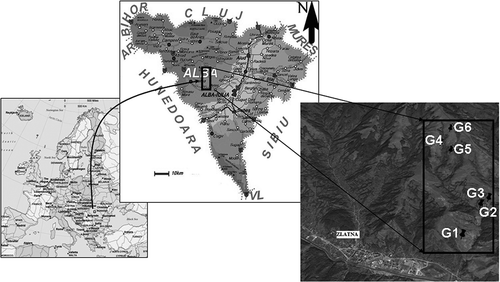
Table I. Abiotic factors from the grassland ecosystems (G1–G6) from Trascău Mountains (± standard deviation). T, Temperature; H, Soil water content; pH, Soil acidity; C, Carbon content; Nt, Total nitrogen; C/Nt, Carbon content/total nitrogen.
Figure 2. Individual-based accumulation curve for species richness of mite community. The shaded area represents the 95% confidence intervals.
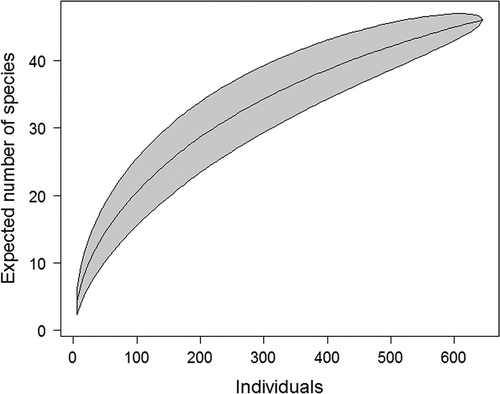
Table II. Numerical abundance of the mesostigmatid mites identified from investigated grassland ecosystems (G1–G6).
Table III. Model selection results. Models are ranked in a decreasing Akaike weight order. For clarity, models with Akaike weight < 0.04 are not shown. Statistics include the log likelihood (LL), the number of estimated parameters (K), the second-order Akaike information criterion corrected for small sample sizes (AICc), AIC difference (ΔAICi) and Akaike weights (wi). Nt = Total nitrogen; Nt + H = Total nitrogen + Soil water content; Nt + T = Total nitrogen + Temperature; Nt + H + C = Total nitrogen + Soil water content + Carbon content; Nt + C = Total nitrogen + Carbon content; Nt + H + T = Total nitrogen + Soil water content + Temperature; Nt + pH = Total nitrogen + Soil acidity.
Figure 3. Canonical correspondence analysis bi-plot of abundance mite species and environmental variables. Length and direction of arrows indicate the relative importance and direction of change in the environmental variables (Ar. se. – Arctoseius semiscissus; As.bi. – Asca bicornis; Am.sp. – Amblyseius sp.; Ch. br. – Cheroseius bryophilus; Ga.bi. – Gamasellodes bicolor; Hy.ac. – Hypoaspis aculeifer; Hy.as. – Hypoaspis astronomica; Hy.ka. – Hypoaspis karawaiewi; Hy.ob. – Hypoapis oblonga; Hy.pr. – Hypoaspis preasternalis; Hy.va. – Hypoaspis vacua; Ev.os. – Eviphis ostrinus; Ip.pu. – Iphidonopsis pulvisculus; Ol.se. – Ololaelaps sellnicki; Pa.pe. – Pachylaelaps pectinifer; Pr. ko. – Prozercon kochi; Pr. py. – Protogamasellus pygmaeus; Pr.mi. – Protogamasellus mica; Rh.de. – Rhodacarus denticulatus; Rh.si. – Rhodacarellus silesiacus; Tr.ir. – Trachytes irenae; Tr. pa. – Trachytes pauperior; Ze.re. – Zerconopsis remiger).
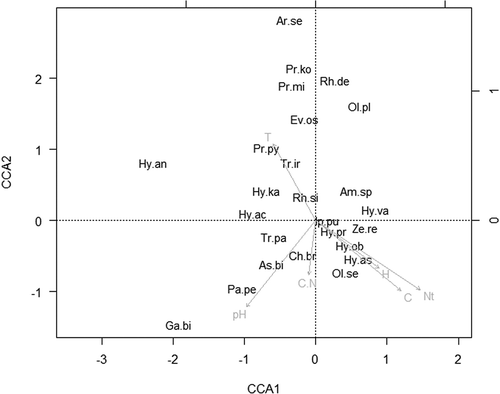
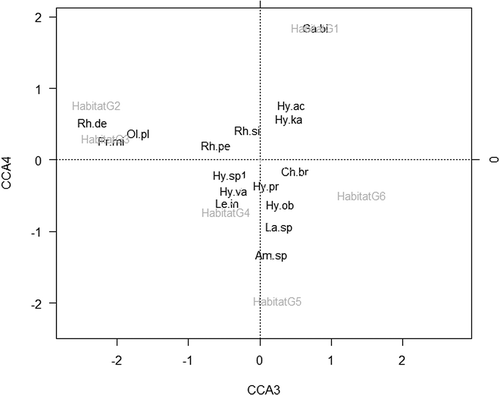
Figure 4. Canonical correspondence analysis bi-plot of abundance of mite species and habitat types (Am.sp. – Amblyseius sp.; Ch. br. – Cheroseius bryphilus; Ga.bi. – Gamasellodes bicolor; Hy.ac. – Hypoaspis aculeifer; Hy.ka. – Hypoaspis karawaiewi; Hy.pr. – Hypoaspis preasternalis; Hy.sp.1 – Hypoaspis sp.; Hy.va. – Hypoaspis vacua; La. sp. – Laioseius sp.; Le.in. – Leioseius insignitus; Ol. pl. – Ololaelaps placentulus; Pr.mi. – Protogamasellus mica; Rh de – Rhodacarus denticulatus; Rh.pe. – Rhodacarellus perspicuus; Rh.si. – Rhodacarellus silesiacus).