Figures & data
Figure 1. Changes in (a), lipid peroxidation (nmol MDA/mg protein) in whole-body homogenate of early larval stages and (b), lipid peroxidation level in serum and midgut of 4th and 5th instar larvae of Antheraea mylitta. Data are expressed as mean ± SEM (n = 6). Means having superscripts of different letters [lower case (a–c): early larva and midgut; upper case (A–B): serum] represent a significant difference from each other within identical tissue (p < 0.05).
![Figure 1. Changes in (a), lipid peroxidation (nmol MDA/mg protein) in whole-body homogenate of early larval stages and (b), lipid peroxidation level in serum and midgut of 4th and 5th instar larvae of Antheraea mylitta. Data are expressed as mean ± SEM (n = 6). Means having superscripts of different letters [lower case (a–c): early larva and midgut; upper case (A–B): serum] represent a significant difference from each other within identical tissue (p < 0.05).](/cms/asset/a5079c68-e6a0-4b82-a360-fc6829d6c2b2/tizo_a_1103319_f0001_b.gif)
Figure 2. Changes in hydrogen peroxide content (nmol/mg protein) in (a), whole-body homogenate of early larval stages and (b), serum and midgut of 4th and 5th instar of Antheraea mylitta. Data are expressed as mean ± SEM (n = 6). Means having superscripts of different letters [lower case (a–c): early larva and midgut; upper case (A–B): serum] represent a significant difference from each other within identical tissue (p < 0.05).
![Figure 2. Changes in hydrogen peroxide content (nmol/mg protein) in (a), whole-body homogenate of early larval stages and (b), serum and midgut of 4th and 5th instar of Antheraea mylitta. Data are expressed as mean ± SEM (n = 6). Means having superscripts of different letters [lower case (a–c): early larva and midgut; upper case (A–B): serum] represent a significant difference from each other within identical tissue (p < 0.05).](/cms/asset/09d34f61-9b08-4665-be64-94b51b46e2c7/tizo_a_1103319_f0002_b.gif)
Figure 3. Changes in superoxide dismutase activity (units/mg protein) in (a), whole-body homogenate of early larval stages and (b), serum and midgut of 4th and 5th instar. Data are expressed as mean ± SEM (n = 6). Means having superscripts of different letters [lower case (a–c): early larva and midgut; upper case (A–B): serum] represent a significant difference from each other within identical tissue (p < 0.05).
![Figure 3. Changes in superoxide dismutase activity (units/mg protein) in (a), whole-body homogenate of early larval stages and (b), serum and midgut of 4th and 5th instar. Data are expressed as mean ± SEM (n = 6). Means having superscripts of different letters [lower case (a–c): early larva and midgut; upper case (A–B): serum] represent a significant difference from each other within identical tissue (p < 0.05).](/cms/asset/897aea8b-f931-4c8e-8b4c-9b1fa1aa5e71/tizo_a_1103319_f0003_b.gif)
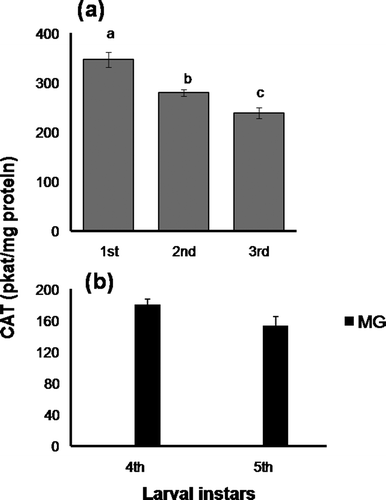
Figure 4. Changes in catalase activity (pkat/mg protein) in (a), whole-body homogenate of early larval stages and (b), midgut of 4th and 5th instar larvae. Data are expressed as mean ± SEM (n = 6). Means having superscripts of different lower case letters (a–c) represent a significant difference from each other within identical tissue (p < 0.05).

Figure 5. Changes in glutathione S-transferase activity (nmol CDNB conjugate formed/min/mg protein) in (a), whole-body homogenate of early larval stages and (b), serum and midgut of 4th and 5th instar larvae. Data are expressed as mean ± SEM (n = 6). Means having superscripts of different letters [lower case (a–b): early larva and midgut; upper case (A–B): serum] represent a significant difference from each other within identical tissue (p < 0.05).
![Figure 5. Changes in glutathione S-transferase activity (nmol CDNB conjugate formed/min/mg protein) in (a), whole-body homogenate of early larval stages and (b), serum and midgut of 4th and 5th instar larvae. Data are expressed as mean ± SEM (n = 6). Means having superscripts of different letters [lower case (a–b): early larva and midgut; upper case (A–B): serum] represent a significant difference from each other within identical tissue (p < 0.05).](/cms/asset/5de3b753-9b2c-47b5-8e21-4ce3a74d8a45/tizo_a_1103319_f0005_b.gif)
Figure 6. Changes in glutathione content (µmol/g tissue wet wt) in (a), whole-body homogenate of early larval stages and (b), GSH content in serum (µmol/mL) and midgut (µmol/g tissue wet wt) of 4th and 5th instar. Data are expressed as mean ± SEM (n = 6). Means having superscripts of different letters [lower case (a–b): early larva and midgut; upper case (A–B): serum] represent a significant difference from each other within identical tissue (p < 0.05).
![Figure 6. Changes in glutathione content (µmol/g tissue wet wt) in (a), whole-body homogenate of early larval stages and (b), GSH content in serum (µmol/mL) and midgut (µmol/g tissue wet wt) of 4th and 5th instar. Data are expressed as mean ± SEM (n = 6). Means having superscripts of different letters [lower case (a–b): early larva and midgut; upper case (A–B): serum] represent a significant difference from each other within identical tissue (p < 0.05).](/cms/asset/7ad8b79c-a75c-4595-9247-cab7df9a13ed/tizo_a_1103319_f0006_b.gif)
Figure 7. Changes in ascorbic acid content in whole-body homogenate (µg/g tissue wet wt) of (a), early larval stages and (b), serum (µg/mL) and midgut (µg/g tissue wet wt) of 4th and 5th instar. Data are expressed as mean ± SEM (n = 6). Means having superscripts of different letters [lower case (a–b): early larva and midgut; upper case (A–B): serum] represent a significant difference from each other within identical tissue (p < 0.05).
![Figure 7. Changes in ascorbic acid content in whole-body homogenate (µg/g tissue wet wt) of (a), early larval stages and (b), serum (µg/mL) and midgut (µg/g tissue wet wt) of 4th and 5th instar. Data are expressed as mean ± SEM (n = 6). Means having superscripts of different letters [lower case (a–b): early larva and midgut; upper case (A–B): serum] represent a significant difference from each other within identical tissue (p < 0.05).](/cms/asset/503960a4-a748-4ddc-ba23-f8a1340f7c68/tizo_a_1103319_f0007_b.gif)
Table I. Protein content, total phenolics, ascorbic acid, glutathione and hydrogen peroxide level in the leaf of the host plant, Terminalia arjuna. Data are expressed as mean ± SEM (n = 6).


