Figures & data
Figure 1. Study area off the Sicilian coast of the Strait of Messina.
Table I. Diet composition of Trachinotus ovatus and percentage values of dietary indexes calculated for each prey item: abundance (%N); weight (%W); frequency of occurrence (%F); index of relative abundance (%IRI). Life stage of prey is also reported (A = adult; J = juvenile; L = various stages of larvae).
Figure 2. Costello graph (modified by Amundsen et al. Citation1996): relationship between frequency of occurrence (%F) of prey items and prey-specific abundance (Pi), expressed as A, number and B, weight, respectively, in the diet of Trachinotus ovatus, collected in the Strait of Sicily. The graph background shows the explanatory Costello diagram and its interpretation of feeding strategy (BPC = between-phenotype component; WPC = within-phenotype component).
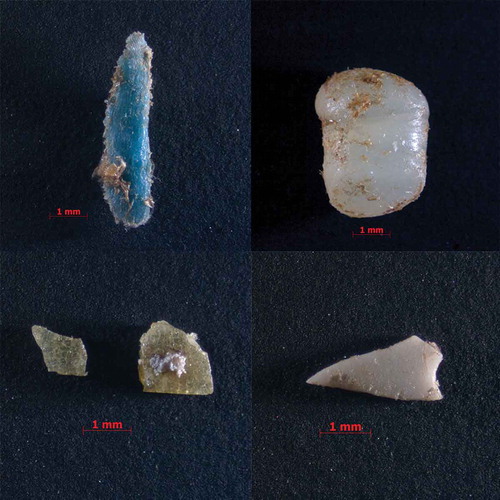
Table II. Data on colour, shape and size of plastic debris in stomach content of Trachinotus ovatus specimens collected in the Strait of Messina. FL = fork length; TW = total weight.
Figure 3. Examples of plastic debris found in the stomach of Trachinotus ovatus.