1,546
Views
1
CrossRef citations to date
0
Altmetric
Research Articles

Tavern proximity, tavern density and socio-economic status as predictors of assault occurrence within New Zealand: a temporal comparison

ORCID Icon, &
Pages 82-98 | Received 26 Oct 2017, Accepted 04 Feb 2018, Published online: 19 Feb 2018

Figures & data

Figure 1. Proportion of assaults where the maximal error in location measurement is less than a specified amount.
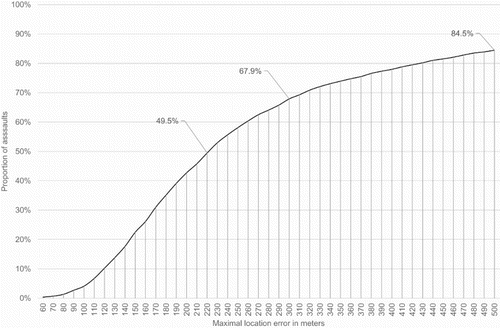
Figure 1. Proportion of assaults where the maximal error in location measurement is less than a specified amount.

Figure 2. New Zealand assaults in 2016 by selected day of week and hour.

Figure 2. New Zealand assaults in 2016 by selected day of week and hour.

Figure 3. Proportion of population, land mass, assaults, peak time assaults and off-peak assaults occurring within a given distance of taverns.
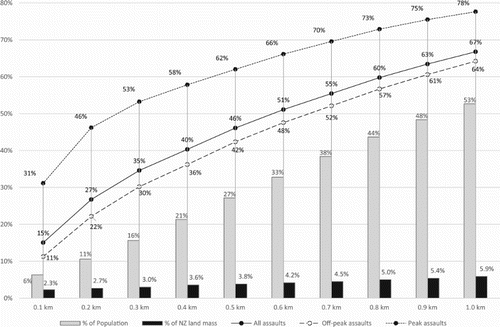
Figure 3. Proportion of population, land mass, assaults, peak time assaults and off-peak assaults occurring within a given distance of taverns.
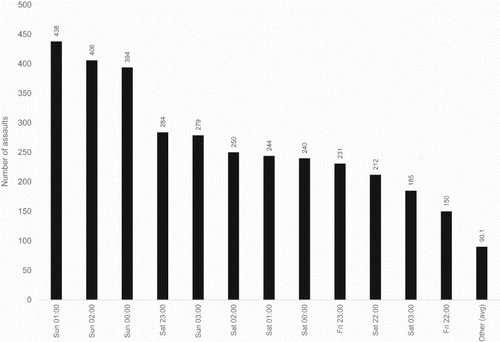
Table 1. Results of logistic regression – Part I.

Table 2. Results of logistic regression - Part II.

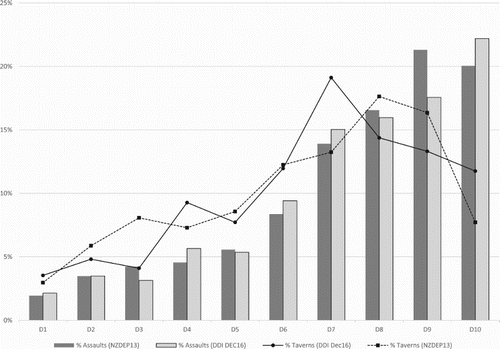
Figure 4. Proportion of all assaults and taverns in 2016 by deprivation decile classification.

Figure 4. Proportion of all assaults and taverns in 2016 by deprivation decile classification.

Reprints and Corporate Permissions

Please note: Selecting permissions does not provide access to the full text of the article, please see our help page How do I view content?

To request a reprint or corporate permissions for this article, please click on the relevant link below:

Academic Permissions

Please note: Selecting permissions does not provide access to the full text of the article, please see our help page How do I view content?

Obtain permissions instantly via Rightslink by clicking on the button below:

If you are unable to obtain permissions via Rightslink, please complete and submit this Permissions form. For more information, please visit our Permissions help page.