Figures & data
Table 1. The 2017 and 2014 elections: party votes and seats.
Table 2. Polling days and results for Labour, across public polling firms, 2017 election campaign.
Figure 1. Enrolment change, official turnout change and age-eligible turnout change 2014–2017 elections. Sources: Electoral Commission (Citation2017b, Citation2017c, Citation2018).
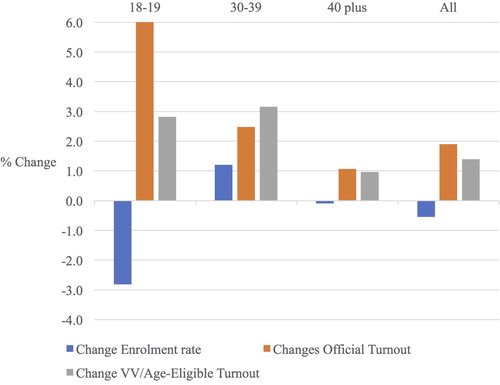
Figure 2. Per cent change in enrolment 2017–2014 by Labour Party Vote in 2014. Source: post-estimation from Model Reported in .
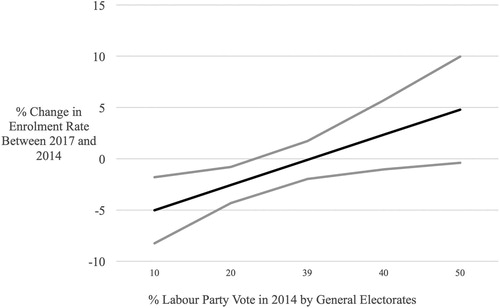
Table 3. Changes in enrolment in general electorates, 2014–2017.
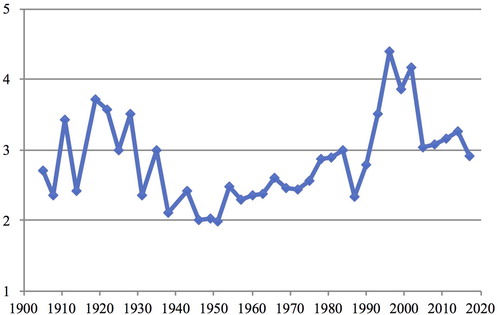
Figure 3. The effective number of elective parties in New Zealand, 1905–2017.