
Figures & data
Figure 1. Distribution of EGVs and EGMs by DDI deprivation decile.
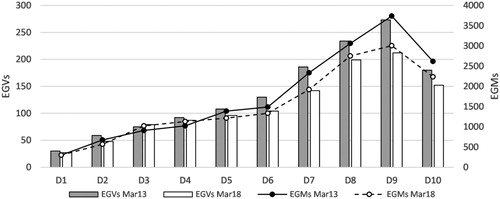
Figure 2. Quarterly nominal GMP and GMP per capita across New Zealand: Mar13–Mar18.
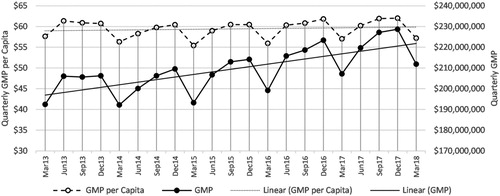
Table 1. Pearson correlation between meshblock NZDEP13 scores and 2013 meshblock GMP per capita (Mar13).
Table 2. Pearson correlation matrix for dependent and independent variables.
Figure 3. GMP per capita map (including location of EGVs) and Dynamic Deprivation Index map of Auckland as of Mar18.
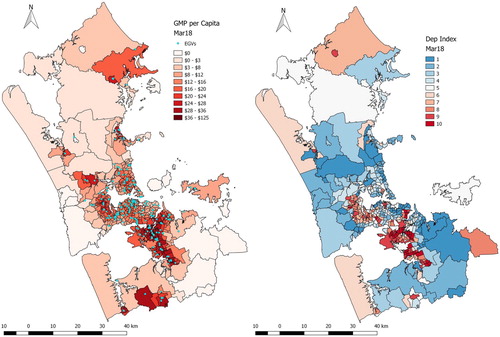
Figure 4. Criterion validity metrics for the DDI. Panel A–Pearson Correlation between GMP per capita and DDI deprivation scores between Mar13 and Mar18. Panel B–Distribution of GMP and GMP per capita by Mar13 deprivation decile and Mar18 deprivation decile.
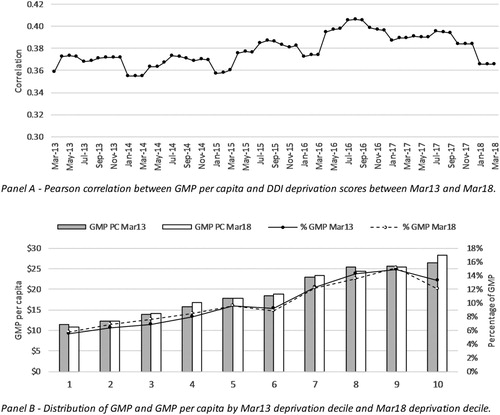
Table 3. Standardised regression coefficients derived from linear regression models of GMP per capita.
Supplemental material