Figures & data
Figure 1. Time (in months) spent living with biological parents for the whole sample.
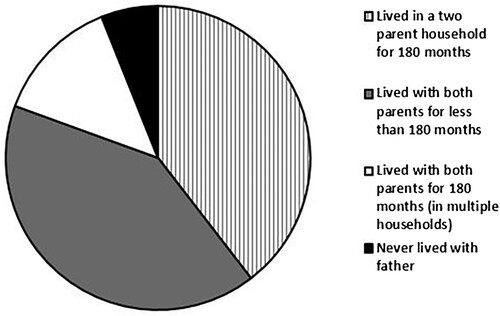
Table 1. Care arrangements by year.
Table 2. Stability of care from one 12-month period to the next for 612 young people.
Table 3. Frequency of change to care arrangement for 612 young people.
Table 4. Relationship of 4855 cohabitants to the participants.
Figure 2. Frequency of the different people living with the participant in 180 months (where ‘count’ on the y axis refers to the number of participants with that number of cohabitants who moved in or out) for the whole sample.
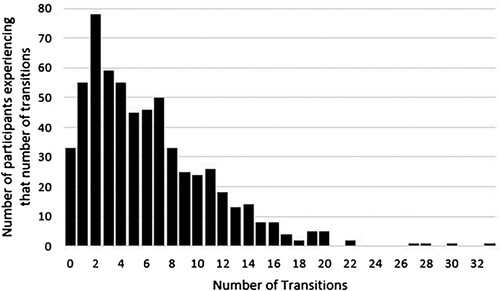
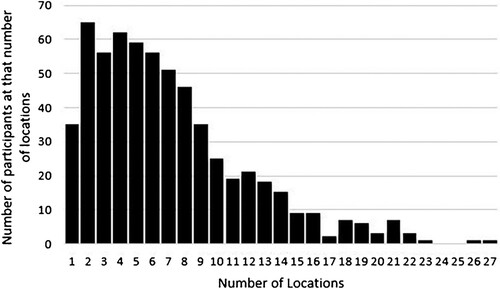
Figure 3. Number of locations that young people have lived in by age 15 (where ‘count’ on the y axis refers to the number of participants with who have lived in that number of locations).