
Figures & data
Table 1. Characteristics of the four subgroups of adult refugees resettled in NZ between 1997 and 2020.
Table 2. Access to education and Housing New Zealand (HNZ) for adults arriving between 1997 and 2020, by subgroup.
Figure 1. Proportions of refugees with main source of income from WAGES AND SALARIES, by years from arrival.
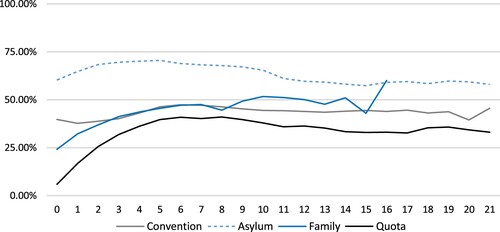
Figure 2. Proportions of refugees with main source of income from SELF-EMPLOYED, by years from arrival.
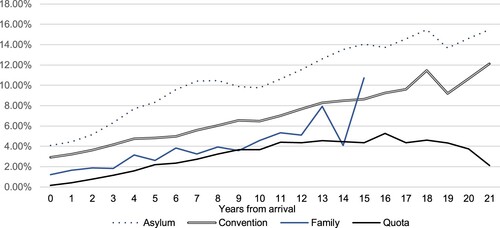
Figure 3. Proportions of refugees with main source of income from a BENEFIT, by years from arrival.
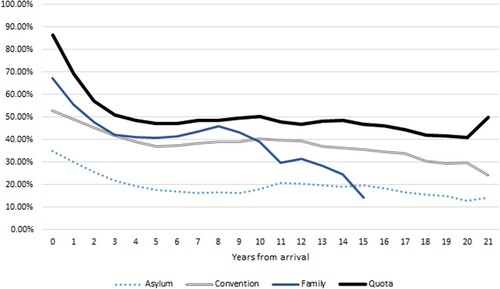
Table 3. Significant variables contributing to income (results from the mixed model) for arrivals before 2012 and after 2012.
Figure 4. Mean income averaged over the years by qualifications and refugee subgroups, adjusted for age and gender (BEFORE 2012).
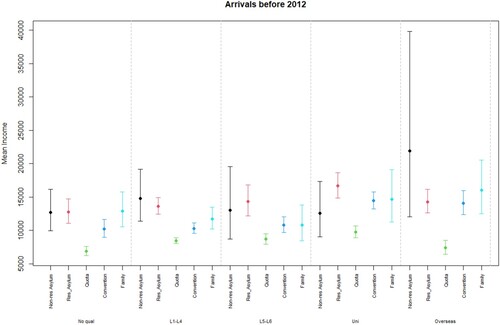
Figure 5. Mean income averaged over the years by qualifications and refugee subgroups, adjusted for age and gender (AFTER 2012).
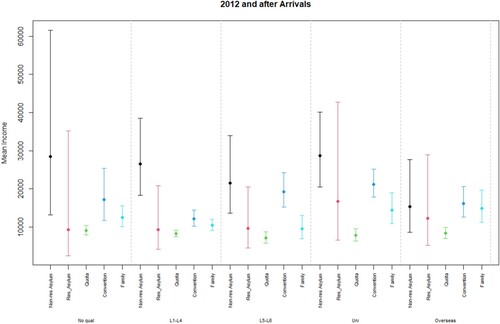
Table 4. Mixed model regression coefficients with longitudinal income as the outcome.