
Figures & data
Figure 1. Location and school roll (population) of primary and intermediate schools within the entire study area (A) and central Auckland (B). The category ‘Rural Area’ includes schools located in rural area, rural centres, minor urban, and secondary urban areas (Ministry of Education Citationn.d.). Base Map: Statistics NZ (Citation2017, Citation2021a).
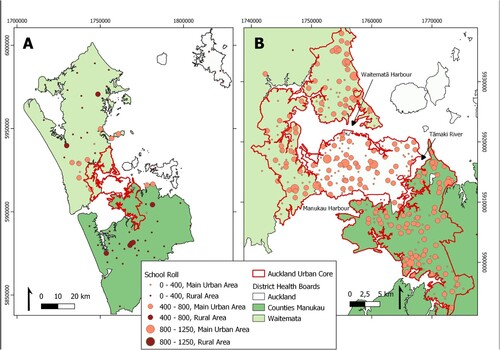
Table 1. Overview of the original data sets.
Figure 2. Kernel density maps of the advertising score (A), school Equity Index (B), and Index of Multiple Deprivation (C) in central Auckland. Base Map: Statistics NZ (Citation2017, Citation2021b).
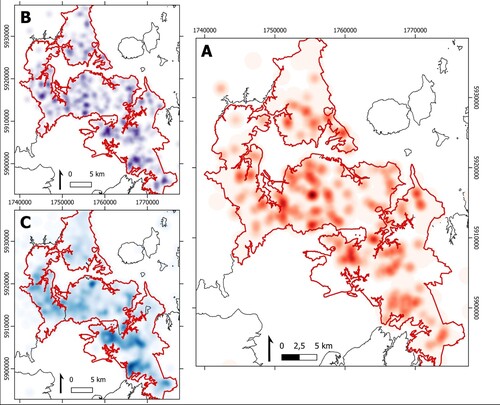
Table 2. Regression coefficients and intercepts for linear regression of the advertising score with Equity Index and covariates.
Supplementary Material - New Maps.docx
Download MS Word (1.2 MB)Data availability statement
The data reported in this study is available upon reasonable request.