
Figures & data
Figure 1. Mobility % Change by Federative Unit.
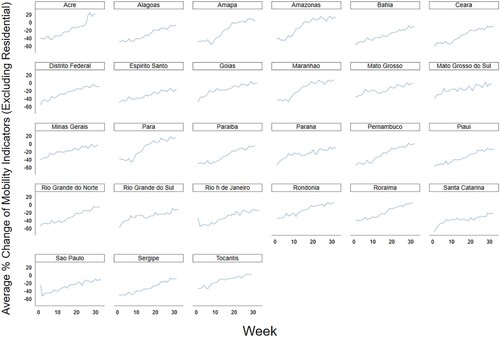
Figure 7. Map of Brazil by Maximum Weekly Deaths and RPR score.
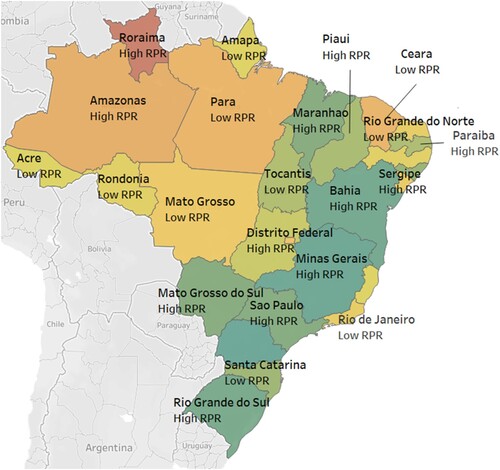
Figure 2. Population 80+ vs. New Weekly Deaths per 100,000.
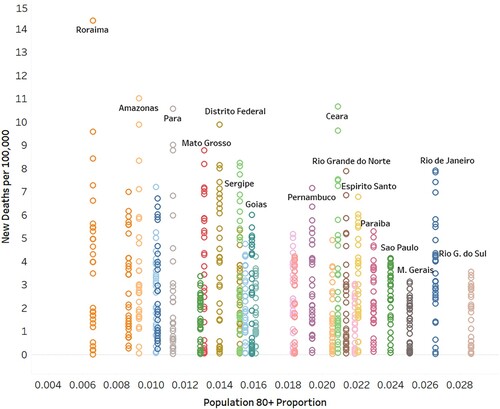
Figure 3. Residential Mobility and New Deaths per 100,000 individuals.
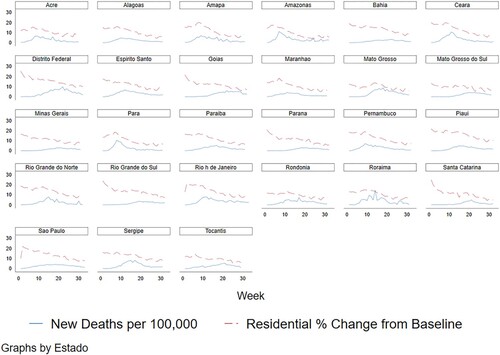
Figure 4. (a) RE Marginal Effects of Responsiveness at increasing levels of RPR (95% Confident Intervals) and (b) GAM Perspective Plot.
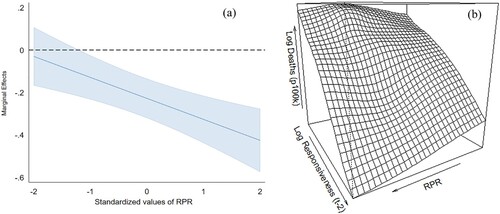
Figure 5. Predictive Margins of New Deaths per 100k (Log) for different levels of Responsiveness.
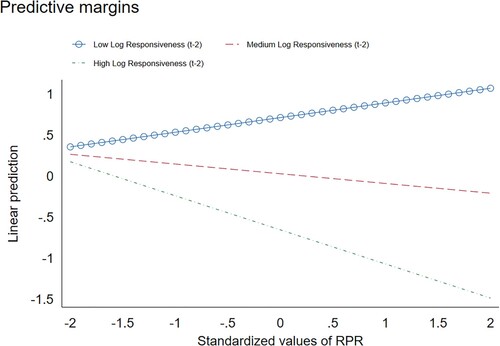
Figure 6. Predicted Values vs Actual Values of New Deaths per 100k (log).
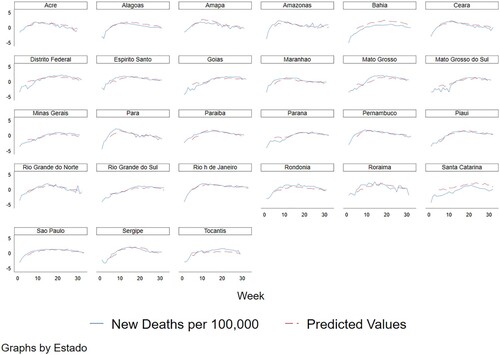
Table A. Hypothesis Testing (t-test) Max Daily Deaths per 100k – High vs. Low RPR.
Table B. Hypothesis Testing (t-test) Cumulative Deaths per 100k – High vs. Low RPR.
Table C. Random Effects Regression with AR (1) Disturbance (Standardized Coef.) and GAM Results.
Table D. Wooldridge test for autocorrelation in panel data (H0: no first order autocorrelation).
Table E. Levin-Lin-Chu Unit Root Test for Logged New Deaths (p 100k) (Ha: Panels are Stationary) (AR Common Across Panels).
Table F. Im-Pesaran-Shin Unit Root Test for Logged New Deaths (p 100k) (Ha: Some panel are Stationary) (AR Panel Specific).
Table G: Random Effects Regression with AR (1) Disturbance (Standardized Coef.) Results (Pop 60 and older).
Table H: Random Effects AR (1) Regression Unstandardized Coefficients.