
Figures & data
Figure 1. Daily deaths per 100,000 people in Canada and the United States. The x-axis corresponds with the number of days since each country reported at least one death from COVID-19.
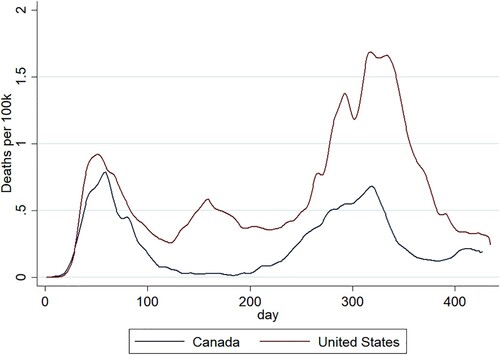
Figure 2. Comparative COVID-19 death tolls in Canada and the United States.
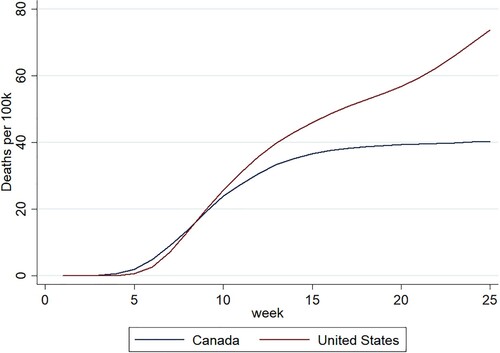
Figure 3. COVID-19 deaths per 100,000 within the Canadian provinces as of March 2021. Quebec omitted as outlier in the analysis.
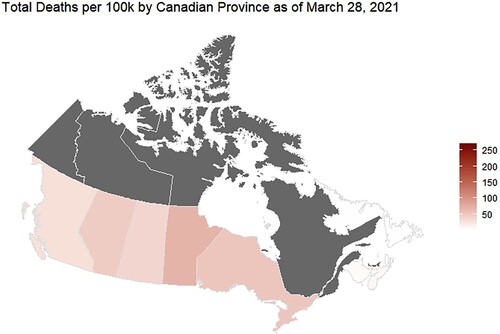
Figure 4. COVID-19 deaths per 100,000 within the United States as of March 2021.
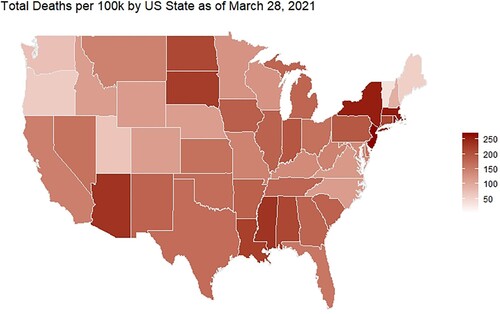
Figure 5. Canadian weighted provincial RPE.
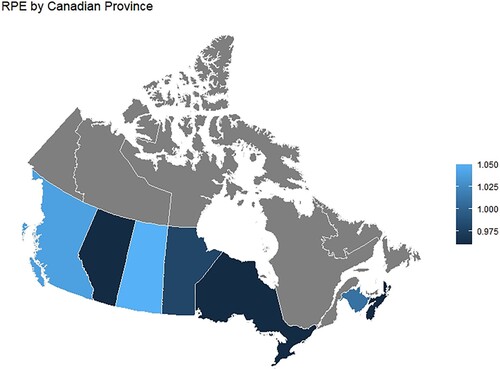
Figure 6. United States weighted state by state RPE.
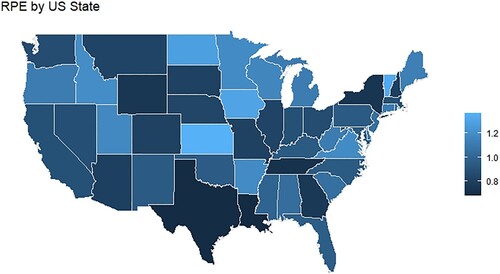
Figure 7. Overlaid time series of Oxford Stringency Index scores in Canada and the United States. The x-axis represents the number of days since the first non-retroactively reported death (U.S. = February 29, 2020. Canada = March 9, 2020).
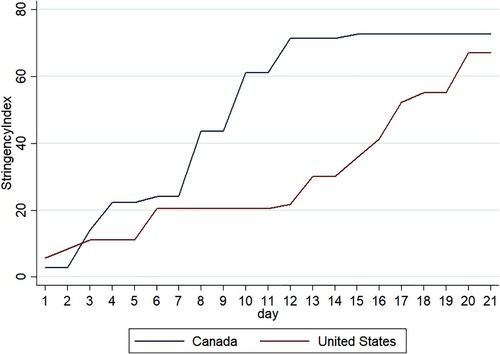
Table 1. Results of a generalized additive model estimating the effects of political capacity and policy responsiveness on death rates from COVID-19 across Canadian provinces and U.S. states. All variables are standardized to allow for a comparison of the relative impact of each variable.
Figure 8. Model 1 conditional marginal effects of Policy Responsiveness and weighted RPE on Total Deaths per 100,000. Full sample. All measures are standardized.
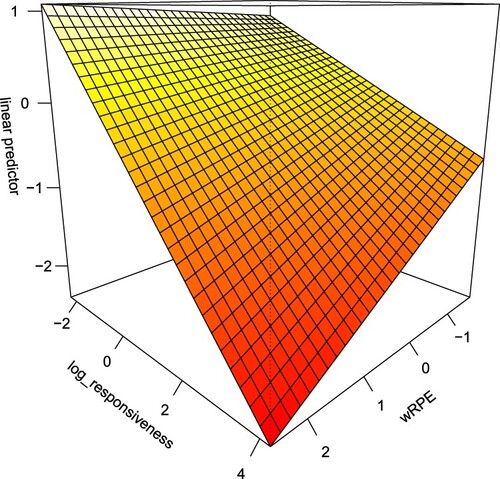
Figure 9. Model 2 conditional marginal effects of Policy Responsiveness and weighted RPE on Total Deaths per 100,000. Canada sample. All measures are standardized.
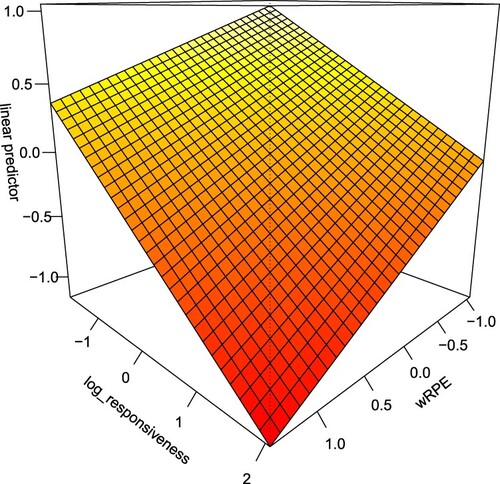
Figure 10. Model 3 conditional marginal effects of Policy Responsiveness and weighted RPE on Total Deaths per 100,000. United States sample. All measures are standardized.
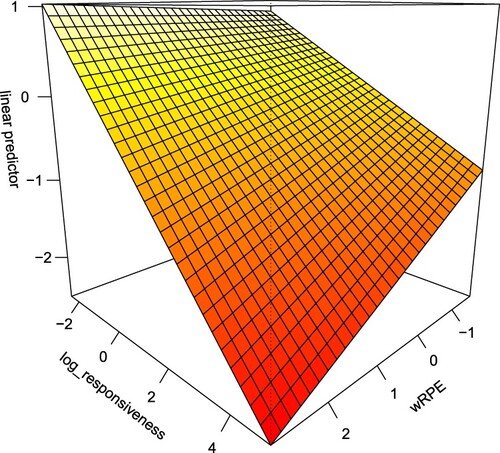
Table A1. Most similar systems design reference data and sources.
Table A2. Scatterplot matrix of relevant variables.
Table A3. Correlation matrix of relevant variables.
Table A4. Summary statistics for model variables.