
Figures & data
Figure 1. Visualization of the non-linear, time-dependent trajectory of deaths per 100,000 people generated by the GAM estimator. The y-axis represents the standardized dependent variable (deaths per 100,000 people, logged).
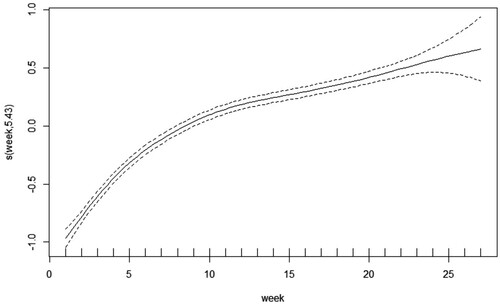
Table 1. Random effects panel regression models of total COVID-19 deaths per 100,000 people as a function of per capita GDP, age structure, government responsiveness, and political reach.Footnote6
Figure 2. Time series of deaths per 100,000 people overlaid with predicted values. The y-axis is on a logarithmic scale.
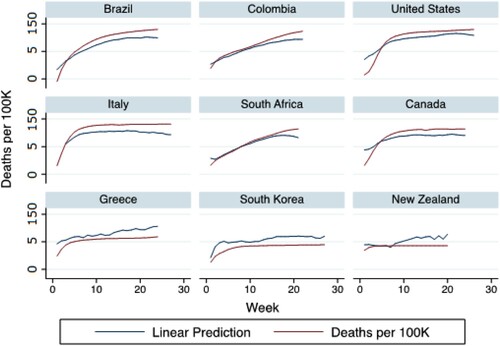
Figure 3. Predicted marginal effects of elderly populations on mortality rates.
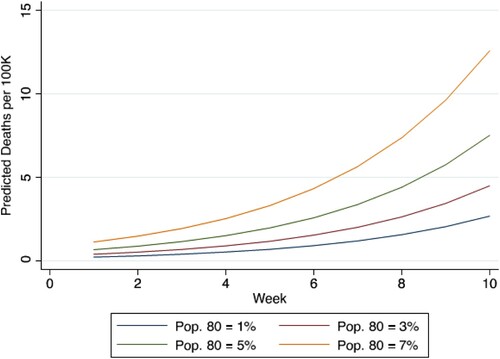
Figure 4. Predicted marginal effects of policy responsiveness on COVID-19 death rates over time.
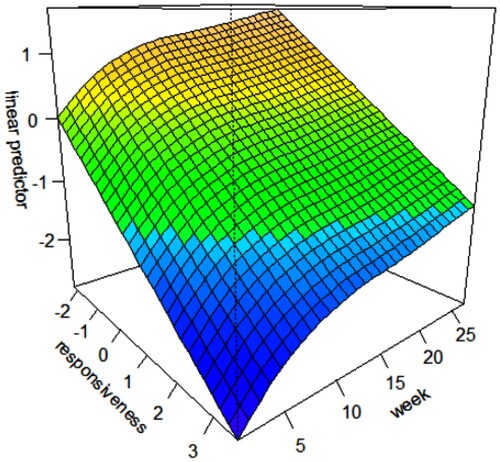
Figure 5. Mean reported COVID-19 deaths for low and high levels of RPR.
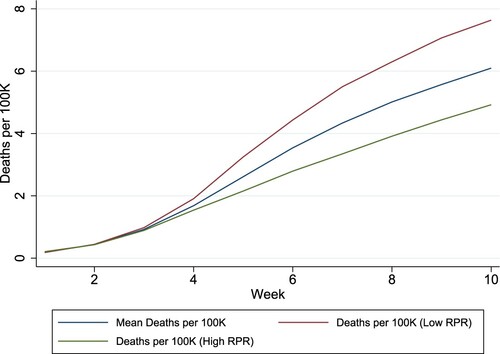
Figure 6. Overlaid time series plots of policy responsiveness and reported COVID-19 deaths per 100,000 people.
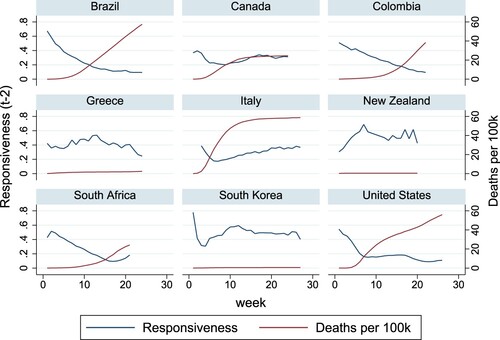
Figure 7. Comparison of death tolls from COVID-19 in Greece and Italy.
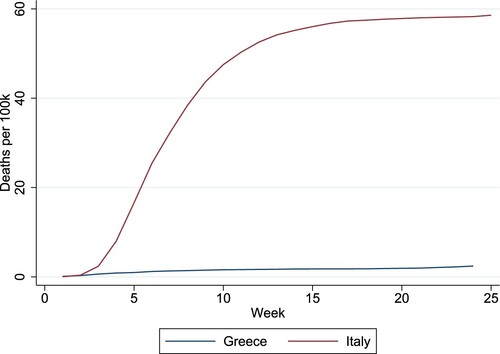
Figure 8. Comparison of death tolls from COVID-19 in Canada and the United States.
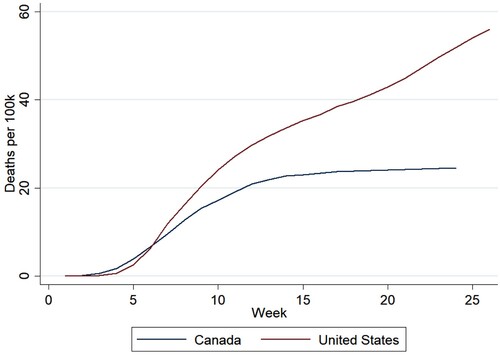
Table A1. Data descriptions and sources.
Table A2. Slope Difference Tests: Pairwise Comparisons of Marginal effects of Responsiveness on Total COVID-19 deaths per 100,000 people.
Table A3. Average Marginal Effects of Responsiveness on Total COVID-19 deaths per 100,000.
Table A4. Summary statistics.