Figures & data
Figure 1. Location of Webb’s Bay (WB), Nain (NA), Kammasûk (KAM), South Aulatsivik (SA) and Dog Island (DI) study sites and significant archaeological sites in the Nain archipelago
Figure 2. (a) Nain site near the town of Nain characterized by an open spruce and larch forest; a sawn tree stump is shown. (b) KAM site near the Kammasûk settlement showing an open spruce and larch forest. (c) WB site at Webb’s Bay characterized by a very open spruce and larch forest; an axe-cut tree stump is shown. (d) SA site on South Aulatsivik Island showing a very open spruce forest on the southern bank of the river. (e) A spruce krummholz found at site DI, near the Oakes Bay 1 archeological site on Dog Island. (f) Site DI showing short spruce trees (2 m) and an axe-cut stump
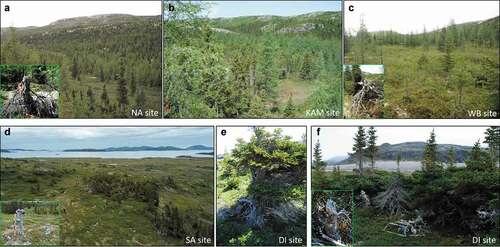
Figure 3. Estimation of Inuit settlement size at the five study sites based on archaeological, oral history and textual historical sources. Population levels are represented in terms of number of households and are extrapolated from historical records and number of archaeological house ruins dated to approximate time intervals
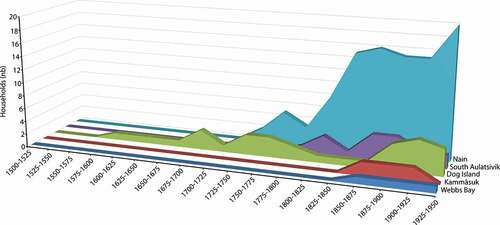
Table 1. Mean ring width (mm) of Picea sp. for 50-year time periods at Nain, Webb’s Bay, Kammasûk, South Aulatsivik and Dog Island
Table 2. Characteristics of Picea sp. samples from each site
Figure 4. For each of the five study sites: (a) number of disturbance events (left, bars) and number of trees (right, line) per decade; (b) residuals of the log-linear regression of the age frequency distributions of release events

Figure 5. Correspondence between growth release events (left, bars) and the scale of local human settlement in the five study sites in terms of extrapolated number of households (right, line) for the last 500 years. The shaded area shows regional forest disturbance between 1900 and 1950. Note that the scale for number of households (right) is not the same for all studied sites. Dotted lines indicate periods when the extrapolated number of households is based exclusively on the number of documented house ruins at archaeological sites, in absence of detailed historical data
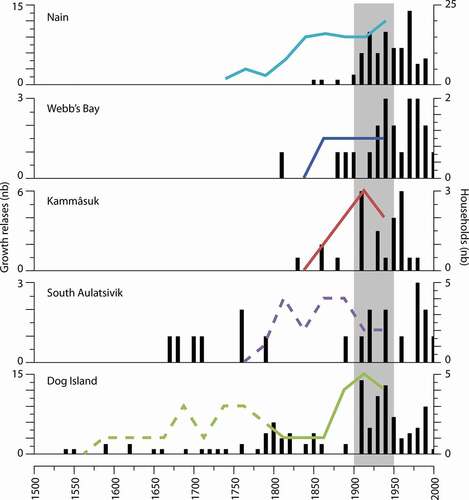
Figure 6. Architectural uses of wood during the evolution of the Inuit winter houses from the 19th to the 20th century. (a) Two examples of winter semi-subterranean sod houses (iglosoak) constructed in the 19th century and typical of the 18th to mid-19th centuries: wood is used in walls, entrance, roof support posts and the roof itself. (b) In Ramah, hybrid house structures combining turf, timber posts and wood planks in the late 19th – early 20th century. (c) In Okak, plank houses and wooden sled dated to ca 1912. (d) In Okak, plank houses with visible stovepipes indicating the use of cast iron stoves, dated to ca 1912. Pictures from Hutton (Citation1912)