
Figures & data
Table 1. Summarizing the key differences between concept drift and data drift.
Figure 1. The diagram of block PCDD.
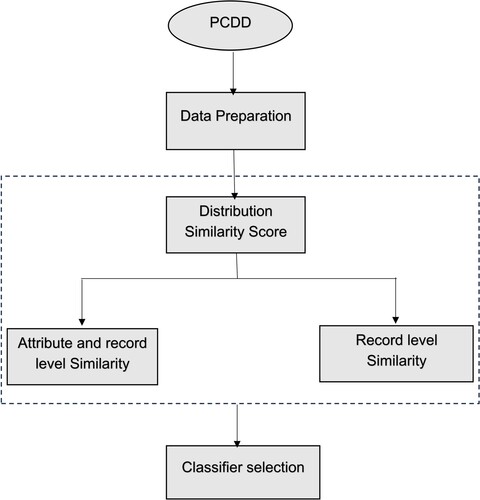
Table 2. Nonstandard abbreviations and acronyms.
Figure 2. The differentiation of the drift detection rates between PCDD and DDAL.
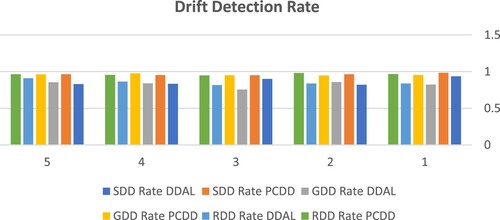
Figure 3. The differentiation of the rates of drift detection error between PCDD and DDAL.
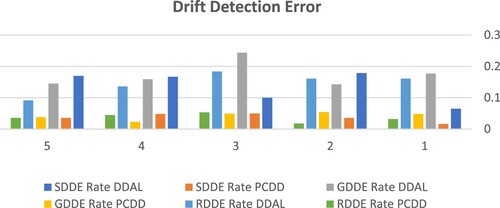
Table 3. The detection rates of concept drift were observed from PCDD and DDAL.
Table 4. The observed rates of drift detection error from both PCDD and DDAL.
Table 5. t-Test and Wilcoxon rank-sum test results, alongside corresponding probability values (p-values).