Figures & data
Table 1. Trajectory of urbanization in Bengaluru (1981-2011).Table Footnotea
Figure 1. Urbanization in Bengaluru: population growth per ward (2011 census data). Source of data: District Census Handbook Bangalore (Directorate of census operations Karnataka, 2014).
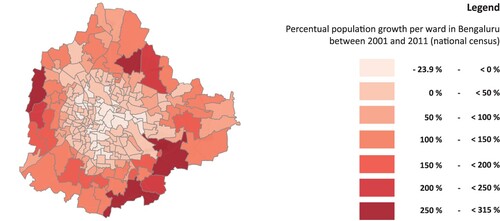
Figure 2. The state’s tap water network in Bengaluru: percentual household coverage per ward (BWSBB, 2017). Source: Smart City Challenge Round 3: Smart City Proposal Bengaluru [Annexures, p. 5] (GoI, 2017).
![Figure 2. The state’s tap water network in Bengaluru: percentual household coverage per ward (BWSBB, 2017). Source: Smart City Challenge Round 3: Smart City Proposal Bengaluru [Annexures, p. 5] (GoI, 2017).](/cms/asset/7bc48737-5ba3-4ff4-abf9-0485c49834aa/rjus_a_1938640_f0002_oc.jpg)
Figure 3. The state’s sewerage network in Bengaluru: percentual household coverage per ward (BWSBB, 2017). Source: Smart City Challenge Round 3: Smart City Proposal Bengaluru [Annexures, p. 5] (GoI, 2017).
![Figure 3. The state’s sewerage network in Bengaluru: percentual household coverage per ward (BWSBB, 2017). Source: Smart City Challenge Round 3: Smart City Proposal Bengaluru [Annexures, p. 5] (GoI, 2017).](/cms/asset/59076fe1-1e2f-4c7a-bf1f-84234c9741ca/rjus_a_1938640_f0003_oc.jpg)
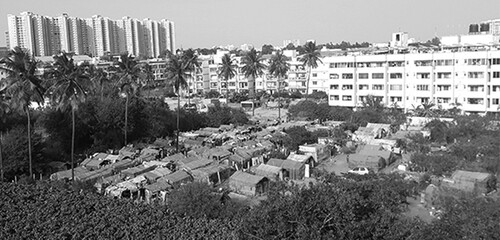
Figure 4. Splintered infrastructure facilitation, by-pass urbanization and segregation in Bengaluru’s peripheries (Source: picture taken by corresponding author, 11 March 2020).