Figures & data
Table 1. Price convergence club classification.
Figure 1. Relative transition paths of subdistricts by club. The thick red line shows clubs average transition path. Each line representing a subdistrict. Symbols indicate the district to which a subdistrict belongs.
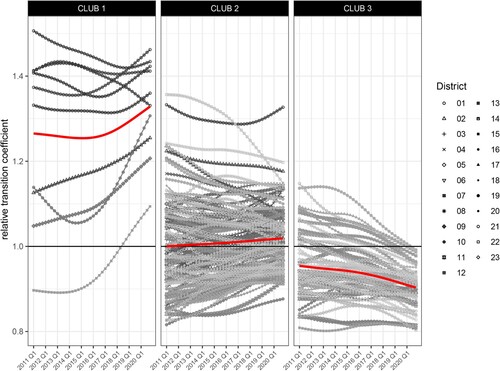
Figure 2. Private rent price convergence clubs of Viennese subdistricts. Map also depicts the Danube (lightblue) and the Ringstraße as well as the Gürtel (darkgrey) as geographic references.
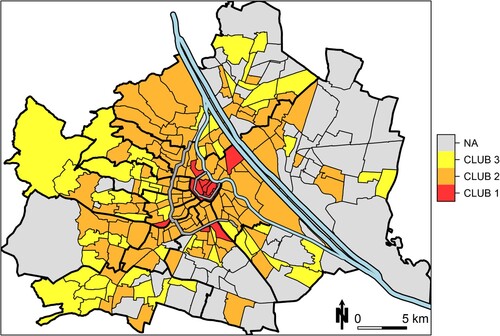
Figure 3. Subdistrict characteristics (2011).
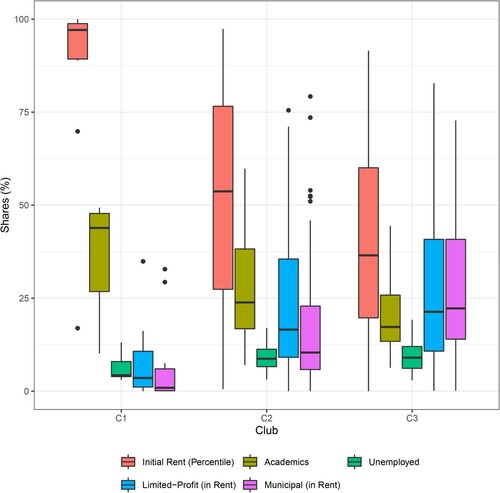
Table 2. Average marginal effects.
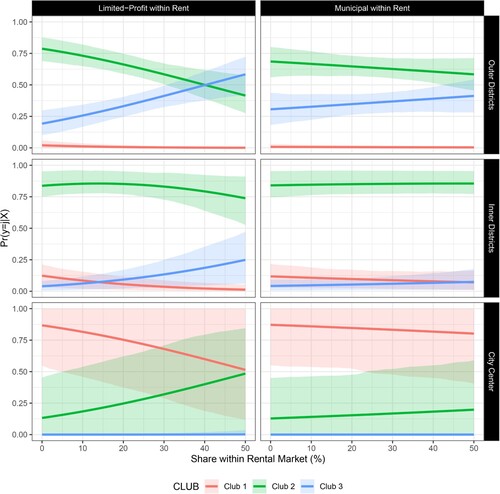
Figure 4. Probability of club memberships based on ordered probit model. Evaluated at the conditional mean of the currently non-varying variables. The range of the depicted x-axis are set in a way to ensure market shares add up to a maximum of 100 %. Shaded areas correspond to the 95% prediction interval based on bootstrapping.