
Figures & data
Figure 1. Correlation matrix. Significance codes: 0 ‘***’ 0.001 ‘**’ 0.01 ‘*’.
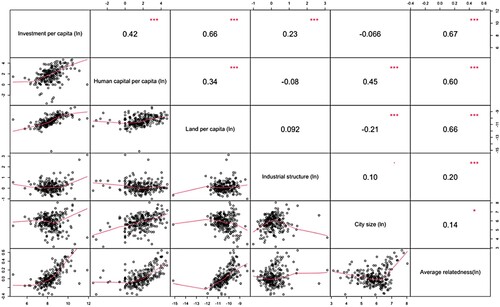
Table 1. Descriptive statistics.
Figure 2. The visualization of top 20% toponym co-occurrence in China.
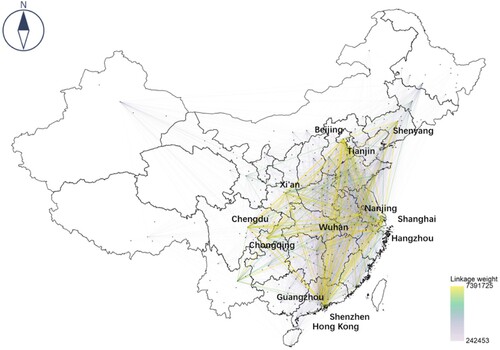
Figure 3. Cities’ aggregated toponym co-occurrence versus GDP rank and population size.
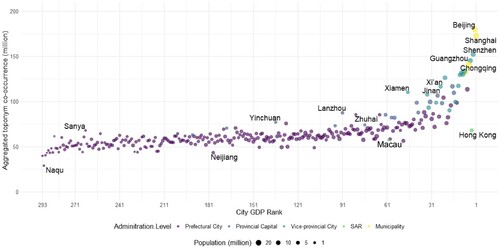
Table 2. Top 10 China aggregated toponym co-occurrence.
Table 3. Gravity model result.
Figure 4. Relative strength of relationships between Chinese cities.
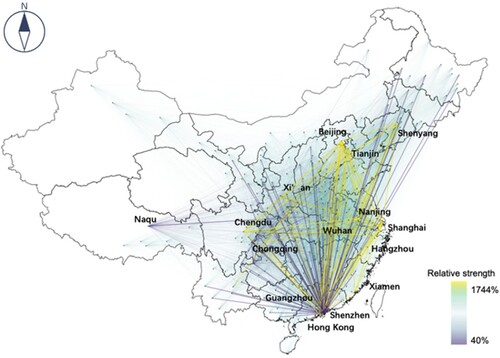
Figure 5. Observed toponym co-occurrences compared with gravity model prediction.
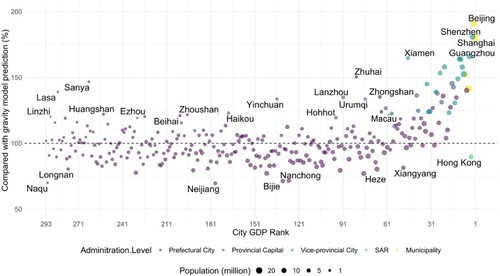
Table 4. Results of regression models on metropolitan productivity.
Table 5. Results of regression models by regions.