Figures & data
Figure 1. Relocation of the junction between Kr curves using schematic manipulation following LSWF.
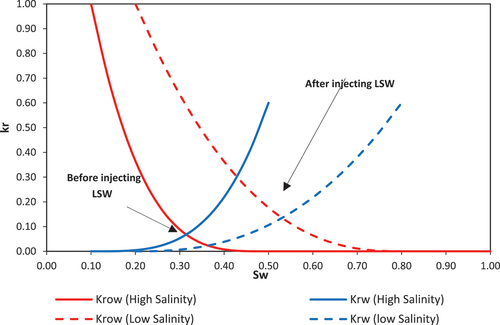
Table 1. SARA components before and after distillation of oil.
Figure 2. Oil viscosity variation vs. pressure (a) and temperature (b).
Table 2. FW, Asmari water, and SW chemical composition (ppm).
Table 3. mineralogy of the rock samples using XRD.
Table 4. Core plugs’ petrophysical properties.
Figure 3. Schematic of the coreflood apparatus.
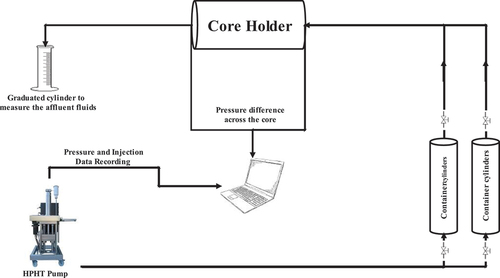
Figure 4. The schematic of the experimental setup for contact angle measurement.
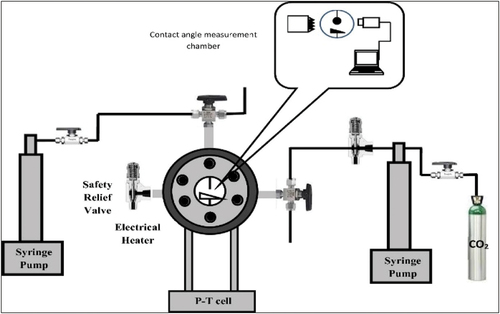
Figure 5. The 3D view of the model.
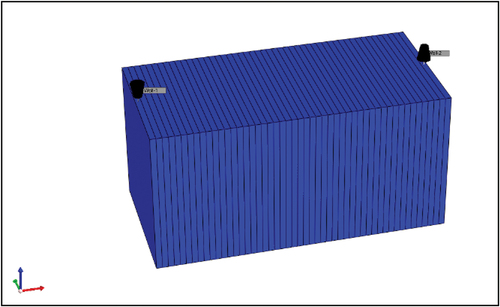
Table 5. rock solution/precipitation reactions.
Table 6. Characteristics of modelling approaches.
Figure 6. Experimental results: (a) SW (b) LoSal-01 (c) LoSal-02 (d) LoSal-03.
Figure 7. ORF for LSWF with different salinities.
Table 7. PDIs’ concentration (ppm) and contact angle (degree) before and after LSWF.
Figure 8. Modelling result of LSWF using fines migration mechanism: (a) SW (b) LoSal-01 (c) LoSal-02 (d) LoSal-03.
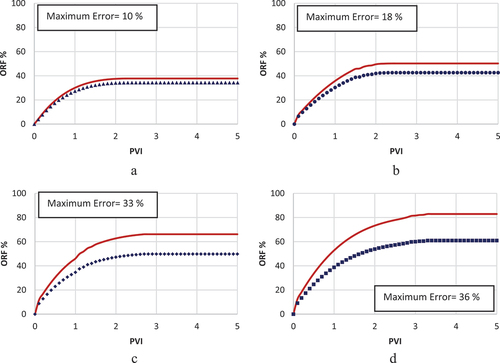
Figure 9. Modelling results of LSWF using rock dissolution/precipitation (a) SW (b) LoSal-01 (c) LoSal-02 (d) LoSal-03.
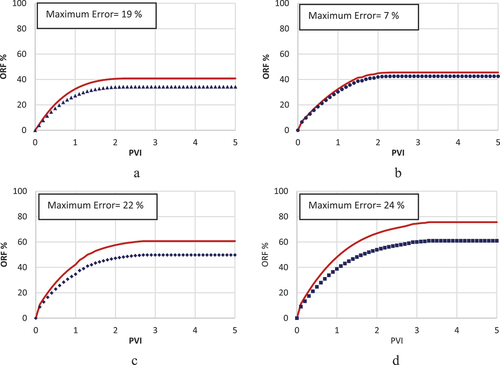
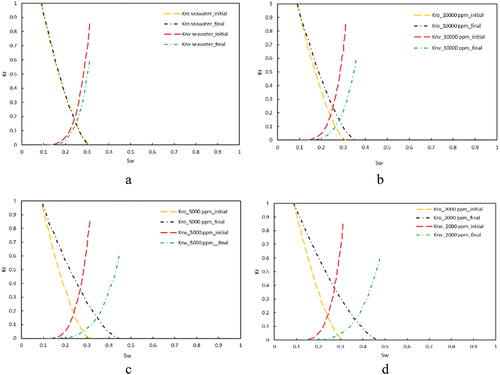
Figure 10. Relative permeability for rock dissolution/precipitation model: (a) SW (b) LoSal-01 (c) LoSal-02 (d) LoSal-03.
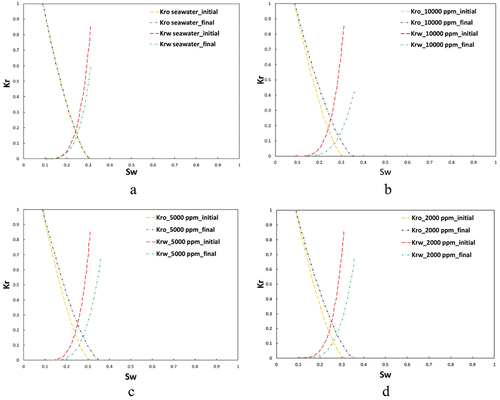
Figure 11. LSWF modelling using MIE mechanism: (a) SW (b) LoSal-01 (c) LoSal-02 (d) LoSal-03.
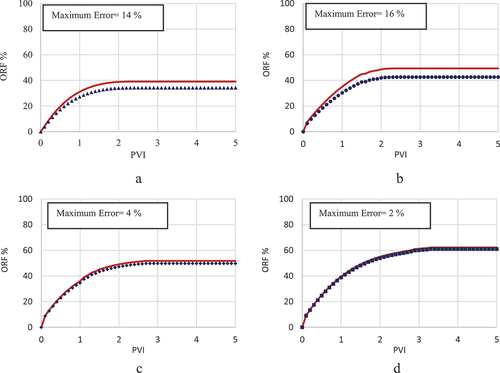
Figure 12. Oil and water relative permeability curves in the MIE model: (a) SW (b) LoSal-01 (c) LoSal-02 (d) LoSal-03.