Figures & data
Table 1. Composition of the experimental diet.
Figure 1. The α-glucosidase and α-amylase inhibitory activities of methanol extract from fruiting bodies of Phellinus pini. (A) α-glucosidase inhibitory activity; (B) α-amylase inhibitory activity. Values are means ± S.D (n = 3). ***p ≤ .001, **p ≤ .01 versus Acarbose.
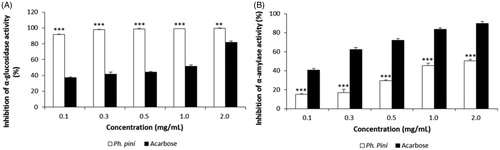
Figure 2. The pancreatic lipase and cholesterol esterase inhibitory activities of methanol extract from fruiting bodies of Phellinus pini. (A) Pancreatic lipase inhibitory activity; (B) Cholesterol esterase inhibitory activity. Values are means ± S.D (n = 3). ***p ≤ .001, **p ≤ .001, *p ≤ .05 versus positive controls.
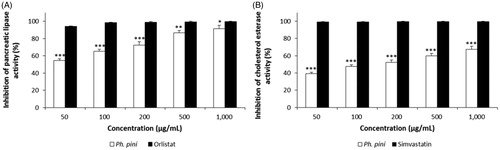
Table 2. Effect of Phellinus pini on body weight and food intake of rats.
Figure 3. Effect of Phellinus pini on plasma low density lipoprotein cholesterol (LDL-C)/high density lipoprotein cholesterol (HDL-C) ratio in rats. Results are means ± SD (n = 8). Different symbol indicates significant differences among groups at **p ≤ .01 as determined by Duncan's multiple range tests. NC: normal control diet; HFC: high fat and cholesterol diet; HFC + PhP: high fat and cholesterol diet supplemented with 5% Phellinus pini fruiting body powder.
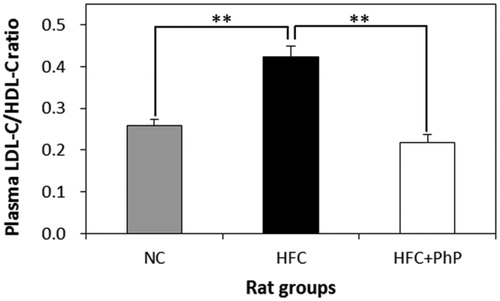
Table 3. Effect of Phellinus pini on plasma lipid profiles in rats.
Table 4. Effect of Phellinus pini on plasma biochemical parameters in rats.
Table 5. Effect of Phellinus pini on plasma enzyme profiles related to liver function in rats.
Table 6. Effect of Phellinus pini on fecal total lipid and cholesterol in rats.
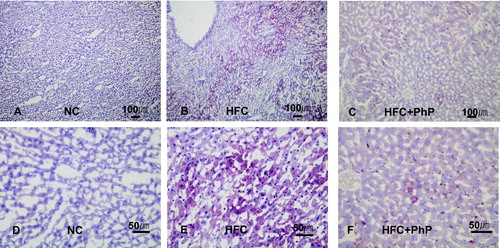
Figure 4. Effect of feeding Phellinus pini on hepatocyte cells in rats. (A–C) oil red O stained photomicrographs at 100×; (D–F) photomicrographs of red O stain at 400×. NC: normal control diet; HFC: high fat and cholesterol diet; HFC + PhP: high fat and cholesterol diet supplemented with 5% Phellinus pini fruiting body powder.