Figures & data
Table 1. Photoinactivation results for the different bacterial strains under the dark condition.
Table 2. Photoinactivation results for the different bacterial strains under the illuminated condition.
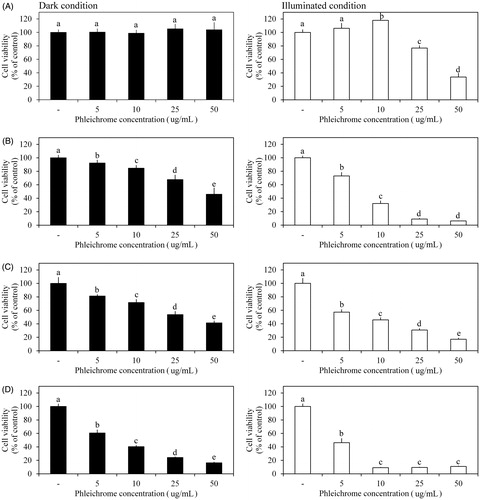
Figure 1. Effects of phleichrome on cancer cell viability. Cell viability was measured in (A) HepG2, (B) HeLa, (C) SW480, and (D) MCF-7 cell lines under dark (black bar) and illuminated conditions (white bar). Results are the means ± standard deviation (SD) of triplicate independent experiments. Statistical analyses were performed using ANOVA at p = .05 using SPSS software (version 23.0, IBM Corp., Armonk, NY).