Figures & data
Figure 1. Purple spot caused by Stemphylium vesicarium on asparagus. (A) Symptoms of purple spot of asparagus ferns in field; (B,C) Signs of the causal fungus of purple spot on asparagus fern and spear by artificial inoculation; (D) Control of non-inoculation; (E,F) Fungal mycelial colonies on PDA and V8 juice agar plates (left, front view; right, back view); (G–I), Conidiophores; and (J) Morphological characteristics of conidia. Scale bars = 10 µm.
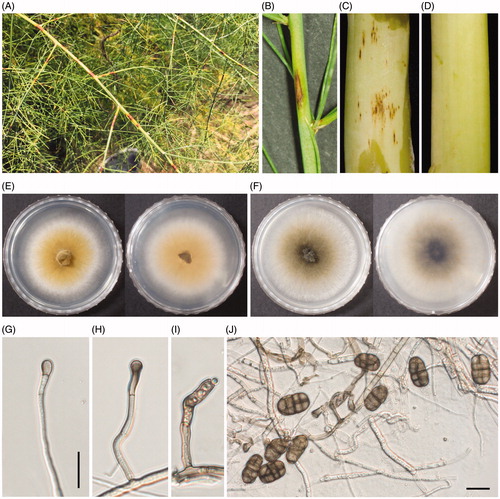
Table 1. Morphological characteristics of Stemphilium vesicarium isolated in this study.
Figure 2. The phylogenetic tree based on combined of ITS and GAPDH gene sequences of Stemphylium vesicarium and other Stemphylium spp. DNA sequences from the GenBank were aligned using the ClustalW program in MEGA 7.0 and constructed using the neighbor-joining method with 1000 bootstrap replicates. The scale bar indicates the number of differences in nucleotide substitutions per sequences.
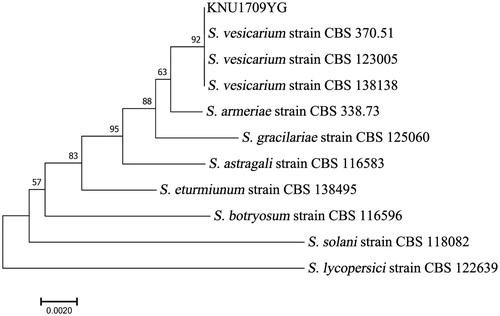
Table 2. Species and sequences used for phylogenetic analyses.
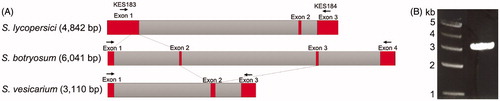
Figure 3. Stemphylium cytochrome b gene. (A) Structural organization of the three Stemphylium cytochrome b genes and (B) cytb amplicon of 3 kb from KNU1709YG using primer set KES183 and KES184.