Figures & data
Figure 1. The in vitro tyrosinase inhibitory rate on two partitioned fractions from mycelial extract of G. weberianum. Chloroform (CF) and ethyl acetate extracts (EA) obtained from 7-day mycelium cultures (x-axis) were tested for potential inhibitory effects in an in vitro tyrosinase assay. The inhibition rate was plotted as a percentage (y-axis).
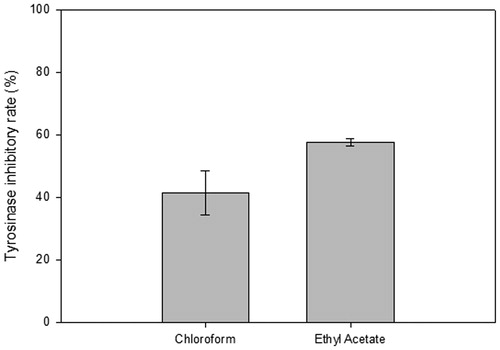
Table 1. The yield of each fractions from the chloroform and ethyl acetate partitioned extracts.
Figure 2. The secreted melanin content from B16–F10 mouse melanoma cells after treated with chloroform (A) and ethylacetate (B) extracts. Melanin inhibition effect which normalized by cells number was determined at 48 h post-treatment and represented as percentage of control (y-axis) when compared against untreated cells (control).
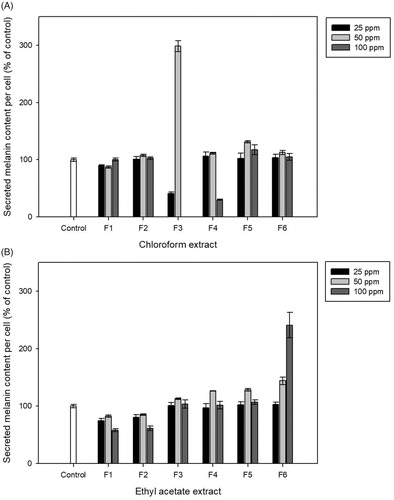
Figure 3. Anti-melanogenic effect of CF-F3 on B16-F10 melanoma cells at 48 h post-treatment with the replacement of medium at 24 h post-treatment. (A) The secreted melanin content of B16-F10 melanoma cells which were treated with CF-F3 at various concentration (x-axis). Secreted melanin inhibition effect which normalized by cells number was represented as percentage of control (y-axis) when compared against untreated cells (control). (B) The intracellular melanin content of B16–F10 melanoma cells which were treated with CF-F3 at various concentration (x-axis). Intracellular melanin inhibition effect which normalized by cells number was represented as percentage of control (y-axis) when compared against untreated cells (control).
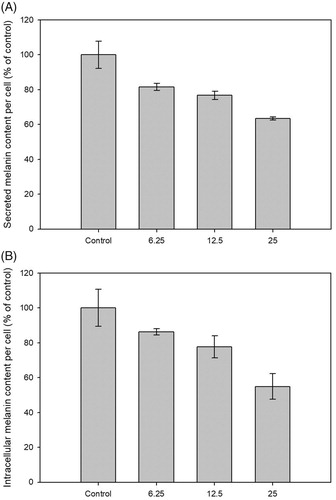
Figure 4. The cytotoxicity analysis of the human HaCaT keratinocyte cells under the treatment of CF-F3. HaCaT human keratinocyte cells were treated with the various concentration of CF-F3, (x-axis). The cytotoxicity effect was determined at 48 h post-treatment and represented as percentage of control (y-axis) when compared against untreated cells (control).
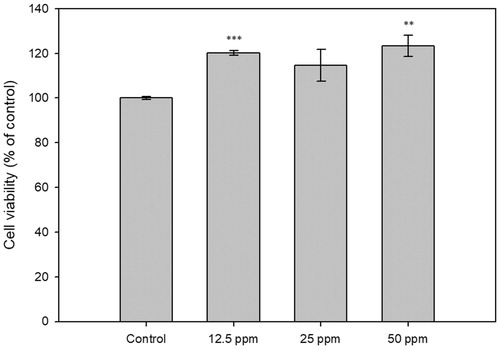
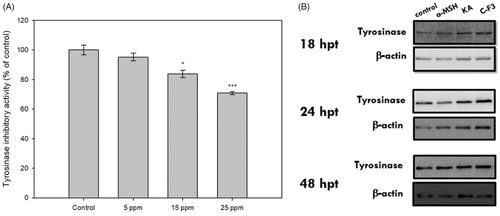
Figure 5. Cellular tyrosinase activity and western blot analysis of the tyrosinase protein expression in CF-F3 treated B16–F10 melanoma cells. (A) The tyrosinase inhibition effects from the various concentrations of CF-F3 (x-axis) were represented as percentage of control (y-axis) when compared against untreated cells (control). (B) B16–F10 melanoma cells at 18, 24, 48 h post-treatment (untreated, 100 nM alpha-melanocyte stimulating hormone (α-MSH), kojic acid (KA), and the CF-F3 fraction) were harvested to extract the total cellular protein for the western blot analysis. As a load control, western blot detection of β-actin was performed.