Figures & data
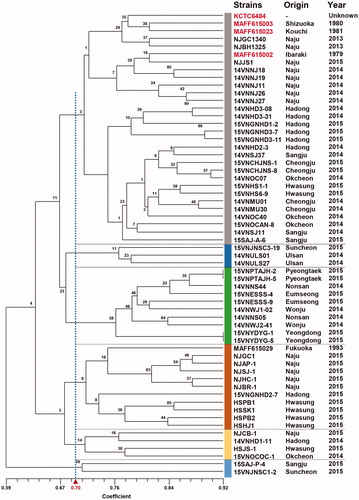
Figure 1. Typical symptoms of pear scab. Irregular dark sooty spots (A) on leaf vein, (B) petiole, and (C) young fruit in early growing season. Irregular mild sooty spot (D) on magnified leaf surface, (E) along the midrib and major lateral veins on the leaf surface, and (F) on mature fruit in late growing season.
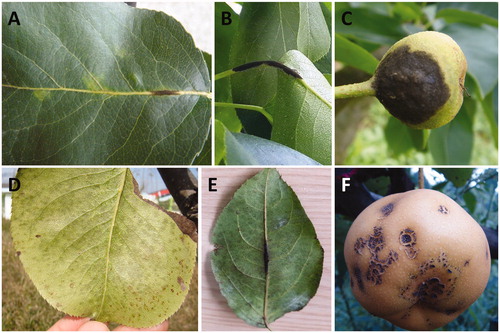
Table 1. Isolates of Venturia nashicola, V. pirina, and V. inaequalis used in this study.
Table 2. Nucleotide sequences of 10-mer oligonucleotide primers used for RAPD analysis of Venturia nashicola isolates.
Figure 2. Mycological characteristics of Venturia nashicola. (A) 60 d-old colony on PDA at 20 °C in the dark; (B) Conidia; (C) Conidiophore; (D) Pseudothecia, (E) Asci; (F) Ascospores.
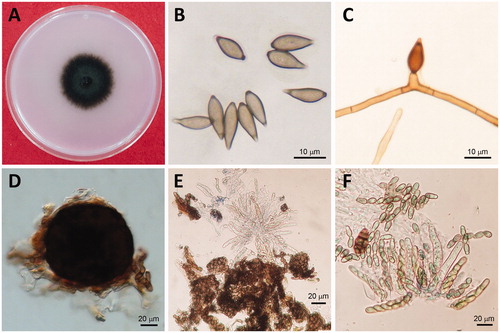
Table 3. Comparison of mycological characteristics of the isolates collected in this study and Venturia nashicola isolates described previously.
Figure 3. Comparison of representative sequences of subgroups 1 to 3. (A) ITS2 region. (B) Partial protein sequences of β-tubulin. (C) Translation elongation factor-1α.
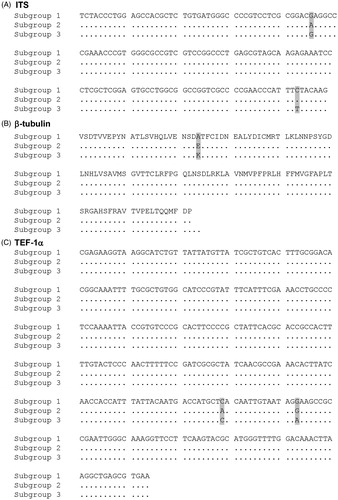
Figure 4. Maximum likelihood tree generated by a combined alignment of ITS region including 5.8S rRNA, partial β-tubulin gene and partial translation elongation factor 1-α gene sequences from Venturia nashicola. All V. nashicola sequences were newly generated in this study, except those marked in red, which were retrieved from GenBank. Standard V. nashicola isolates from Korea (KCTC, Korean culture collection) and Japan (MAFF) are indicated in blue. Isolates of V. pirina and V. inaequalis were used as outgroups. The numbers at nodes represent the percentage of their occurrence in 1000 bootstrap replicates.
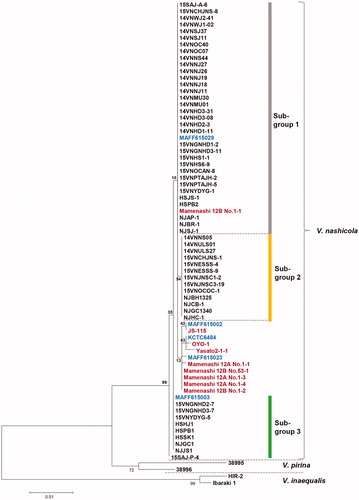
Figure 5. Collection map of Venturia nashicola isolates from Japanese pear in Korea over 2013–2015 and distribution of subgroups 1 to 3. n=number of isolates.
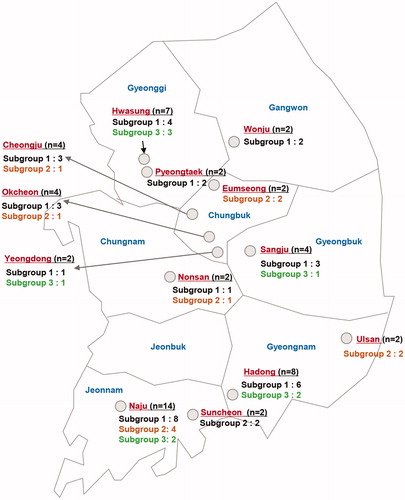
Figure 6. UPGMA dendrogram of 55 Venturia nashicola isolates collected in this study and five standard V. nashicola isolates based on RAPD polymorphism. Data from 10 different 10-mer primers were combined and used to construct a dendrogram. Origin and year of collection was indicated on the right for individual isolates. Standard V. nashicola isolates of Korea and Japan are indicated in red.