Figures & data
Figure 1. Distribution maps of Macrolepiota species in Korea. (a); Macrolepiota detersa, (b); M. mastoidea, (c); M. procera, and (d); M. umbonata.
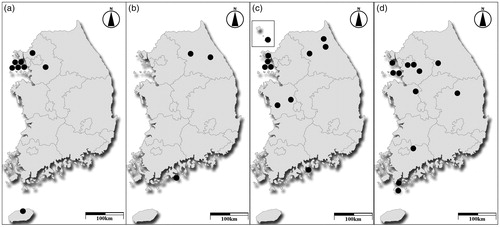
Table 1. Korean Macrolepiota species, collection information, and GenBank accession numbers used in this study.
Figure 2. Phylogeny of Macrolepiota species based on a maximum-likelihood analysis of the ITS region. Bootstrap values >70% are indicated. The scale bar indicates the number of expected nucleotide substitutions per site. Macrolepiota species found in Korea are denoted by the gray boxes.
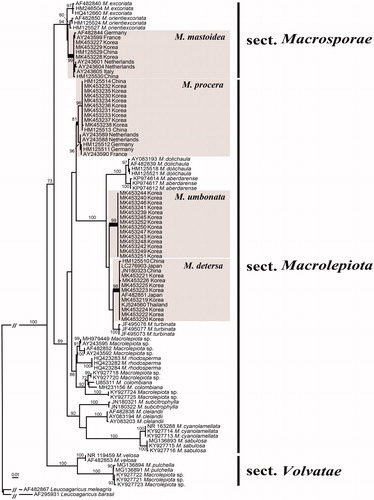
Figure 3. Basidiocarp (left column), pileal squamules (middle column), and annulus (right column) of Macrolepiota species. (a–d); M. detersa (bar = 5 cm), (e–h); M. mastoidea (bar = 2.5 cm), (i–l); M. procera (bar = 5 cm), and (m–p); M. umbonata (bar = 2.5 cm). Red arrow on the middle and right columns points to the pileal suamules and annulus, respectively.
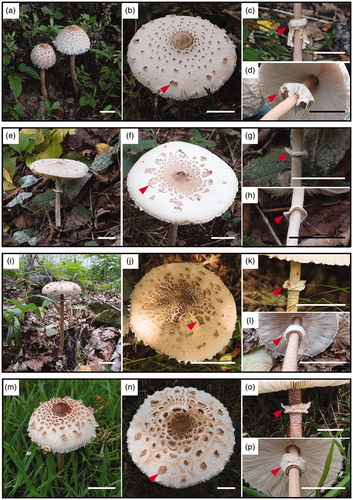
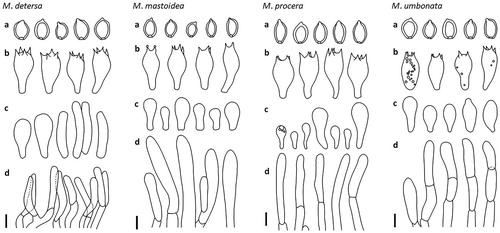
Figure 4. Microscopic features of the Macrolepiota detersa: M. mastoidea, M. procera, and M. umbonata. (a); basidiospores, (b); basidia, (c); cheilocystidia, and (d); hyphae of squamules on pileus. Scale bar = 10 mm.