Figures & data
Table 1. Primers used in this study.
Figure 1. Phylogenetic analysis of MoPAS1. (A) Phylogenetic tree analysis of MoPAS1. A neighbor-joining tree of the amino acid sequence of PAS proteins. Numbers at nodes represent bootstrap values calculated from 1000 replicates. The scale bar indicates the number of amino acid differences per site. Sequence information was taken from the NCBI protein database. GenBank accession number for each protein is followed by species; (B) Predicted domain structure of MoPAS proteins. Sequence information was taken from the Magnaporthe genome database of the Broad Institute, and domain structure analysis was performed using InterPro Scan (http://www.ebi.ac.uk/interpro/). PAS (period circadian protein, aryl hydrocarbon receptor nuclear translocator protein, single-minded protein; IPR0000014), PAC (C-terminal to PAS motifs; IPR001610), HisKA (signal transduction histidine kinase; IPR003661), HATPase_C (histidine kinase-like ATPase; IPR003594), GAF (domain present phytochrome and cGMP-specific phosphodiesterases; IPR003018), REC (signal receiver domain; IPR001789), PHY (phytochrome; IPR001294), S/T kinase (serine/threonine kinase; IPR008271), RGS (regulator of G protein signaling; IPR016137), ZNF_GATA (zinc finger, GATA-type; IPR000679).
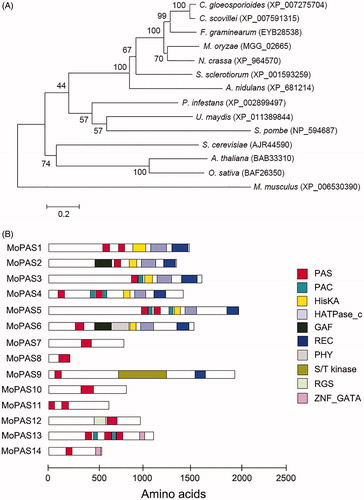
Figure 2. Gene deletion construct and identification of deletion mutants. (A) MoPAS1 was deleted through the targeted gene replacement method; (B) Confirmation of MoPAS1 deletion using Southern blot analysis. DNA samples were digested with SacI. A 1.9-kb band from wild-type KJ201 and a 3.4-kb band from knock-out mutants were produced. Lane 1, wild-type; lane 2–3, knock-out mutants; (C) Confirmation of MoPAS1 deletion and complemented transformant Mopas1c using RT-PCR.
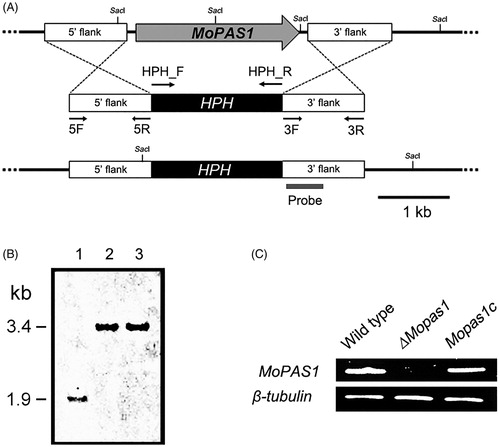
Figure 3. Conidiation and conidiophore differentiation. (A) Microscopic visualization of conidia and conidiophores in the wild-type strain, ΔMopas1, and Mopas1c; (B) Quantitative measurement of conidia. Each strain was grown on OMA for 7 d, and conidia were counted using a hemocytometer. Asterisks represent significant differences from the wild-type strain (Tukey’s test, p < .05).
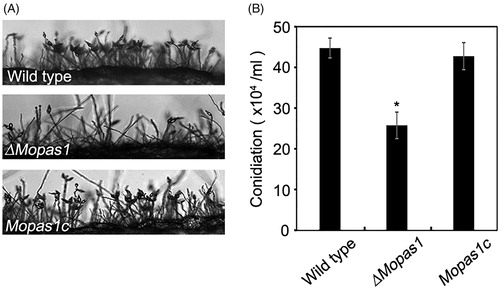
Figure 4. Appressorium formation. (A and B) Conidial suspensions of the wild-type strain, ΔMopas1, and Mopas1c were incubated for 12 hpi on hydrophobic surfaces. For cAMP assays, conidial suspensions of each strain were incubated for 12 hpi on hydrophobic surfaces. cAMP solutions were added to the conidial suspensions to a final concentration of 5 mM at 2 hpi. Asterisks represent significant differences from the wild-type strain (Tukey’s test, p < .05). Bar = 50 μm.
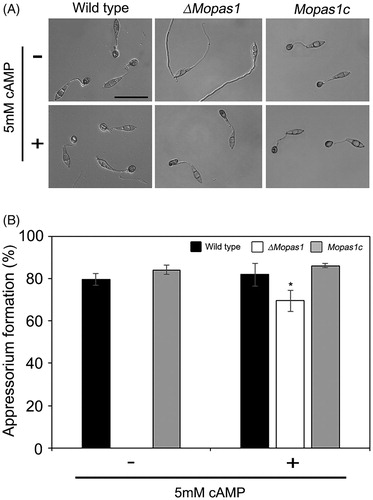
Figure 5. Surface hydrophobicity assessment of mycelia. (A) Drops (10 μL) of water or 0.2% SDS were placed on the colony surface of each strain grown on oatmeal agar plates for 10 d; (B) Quantitative measurement of MPG1 and MHP1 gene expression in the mycelia of ΔMopas1 by qRT-PCR, normalized to β-tubulin and expressed relative to expression in the mycelia of the wild-type strain.
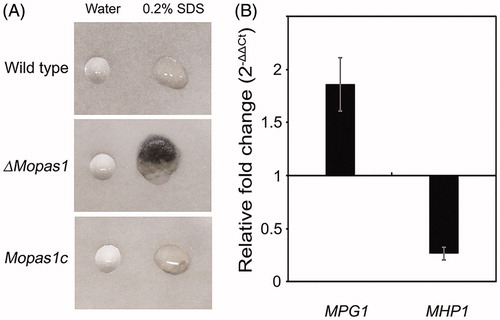
Figure 6. Pathogenicity assays. (A) Leaves of the rice cultivar Nakdongbyeo were inoculated with mycelial agar plugs and incubated for 7 d; (B) Conidial suspensions were sprayed onto rice leaves and incubated for 7 d; (C) Conidial suspensions of each strain were inserted into rice sheath and onion epidermis and incubated for 48 h. Bar = 50 μm.
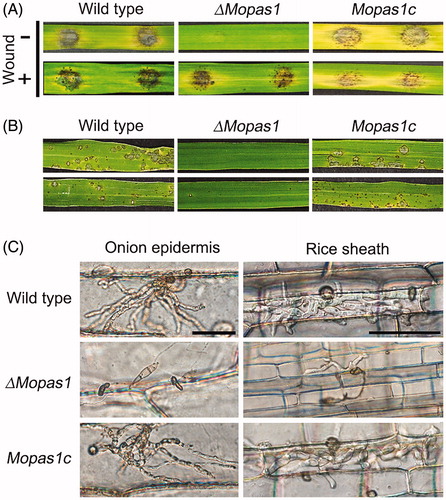
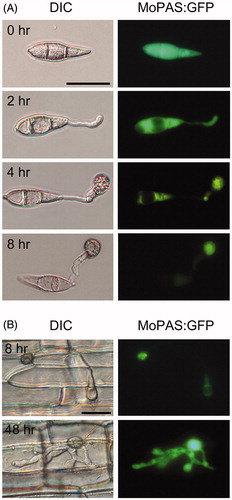
Figure 7. Localization of MoPAS1:GFP in Magnaporthe oryzae strain KJ201 on hydrophobic coverslips or in plants. (A) During appressorium development on hydrophobic coverslips, MoPAS1:GFP was localized in the conidia, germ tubes, and appressoria; (B) In planta observations in rice sheath. MoPAS1:GFP were uniformly localized in invasive hypha. Bar = 20 μm.