Figures & data
Figure 1. Sampling spot (top) in the floor plan of the sampled house and photos of the fungus contaminated built-in furniture (bottom). (A) The inside of closet in dress room (sampling spot1); (B) The back side of built-in furniture in dress room (sampling spot2); (C) The back side of closet in room 1 (sampling spot3); (D) Built-in furniture below the gas range in kitchen (sampling spot4); (E) The shelf of built-in furniture in kitchen (sampling spot5); (F) The built-in furniture in underneath of the sink in kitchen (sampling spot6).
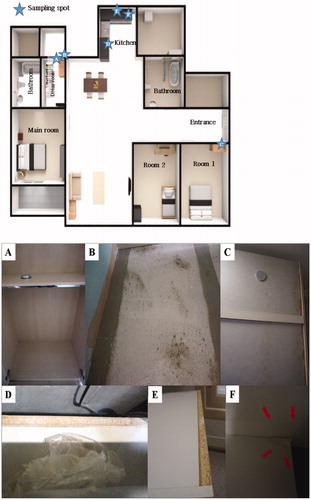
Figure 2. Colony morphologies of the fungal isolates from six sampling spots formed on four different nutrient agar media after growing for 10 days at 25 °C.
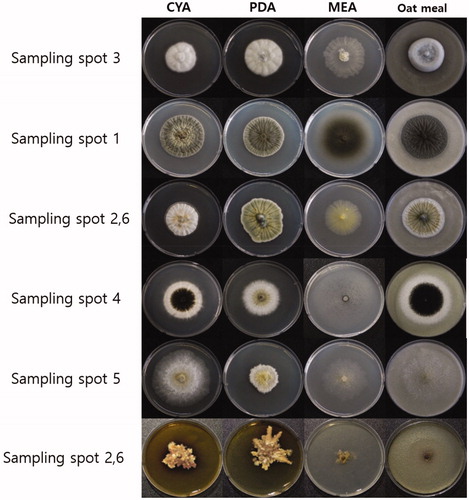
Figure 3. Dissecting microscopic images of the six representative isolates from this study (scale bars = 1 mm). (A) Isolate of sampling spot3, Penicillium sp1 DUCC6000; (B) Isolate of sampling spot1, Cladosporium sp.1 DUCC6005; (C) Isolate of sampling spot2, Aspergillus sp.1 DUCC6001; (D) Isolate of sampling spot4, Aspergillus sp.2. DUCC6003; (E) Isolate of sampling spot5, Aspergillus sp.3 DUCC6002; (F) isolate of sampling spot6, Aspergillus sp.4 DUCC6004.
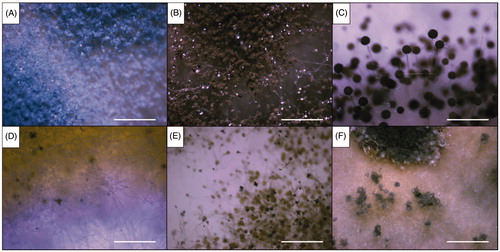
Figure 4. Optical microscopic images of the six representative isolates from this study (scale bars = 10 µm). (A) Isolate of sampling spot3, Penicillium sp1 DUCC6000; (B) Isolate of sampling spot1, Cladosporium sp.1 DUCC6005; (C) Isolate of sampling spot2, Aspergillus sp.1 DUCC6001; (D) Isolate of sampling spot4, Aspergillus sp.2. DUCC6003; (E) Isolate of sampling spot5, Aspergillus sp.3 DUCC6002; (F) isolate of sampling spot6, Aspergillus sp.4 DUCC6004.
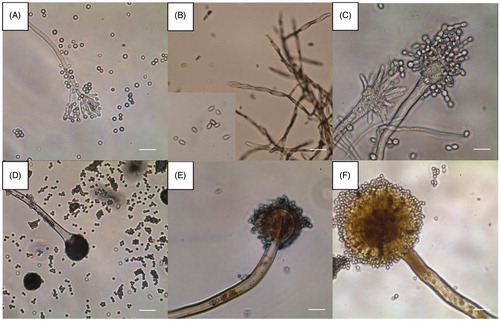
Figure 5. Phylogenetic tree for P. commune and related species based on neighbor-joining analysis of partial calmodulin gene region sequence using MEGA 5.0. The numbers at the nodes indicate the bootstrap support calculated for 1,000 repetitions. The scale bar indicates 0.05 substitutions per nucleotide position, outgroup is Trichoderma viride.
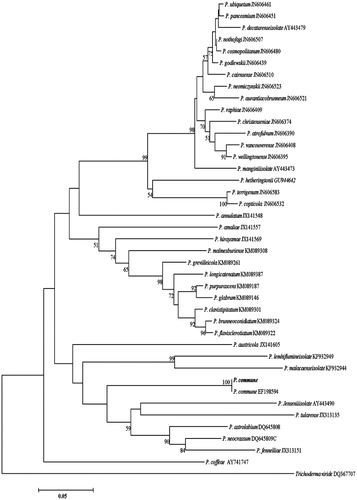
Figure 6. Phylogenetic tree for C. perangustum and related species based on neighbor-joining analysis of translation elongation factor 1 α (TEF - 1α) gene region sequence using MEGA 5.0. The numbers at the nodes indicate the bootstrap support calculated for 1,000 repetitions. The scale bar indicates 0.1 substitutions per nucleotide position, outgroup is Cercospora sojina. C. perangustum: Cladosporium perangustum DUCC6005.
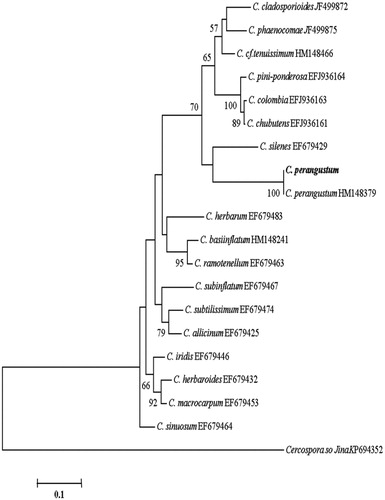
Figure 7. Phylogenetic tree for the four Aspergillus isolates and related species based on neighbor-joining analysis of partial calmodulin gene region sequence using MEGA 5.0. The numbers at the nodes indicate the bootstrap support calculated for 1,000 repetitions. The scale bar indicates 0.05 substitutions per nucleotide position, outgroup is Trichoderma viride. A. niger: Aspergillus niger DUCC6001, A. creber: Aspergillus creber DUCC6004. A. ruber: Aspergillus ruber DUCC6002, A. pseudoglucus: Aspergillus pseudoglaucus DUCC6003.
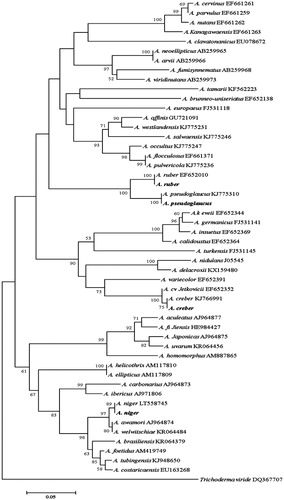
Table 1. Extracellular enzyme activity test of fungi isolated from the built-in furniture.
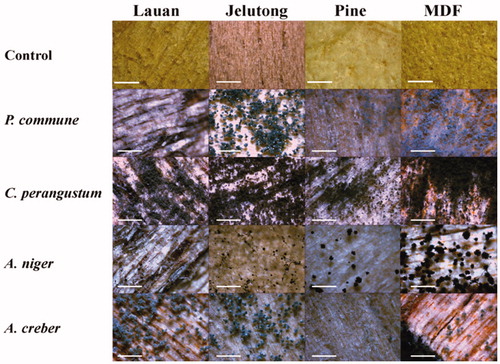
Figure 8. Results of inoculation test on wood chips at 25 °C and 30% humidity condition for 10 days (×45, scale bar = 1 mm). P. commune: Penicillium commune DUCC6000, C. perangustum: Cladosporium perangustum DUCC6005, A. niger: Aspergillus niger DUCC6001, and A. creber: Aspergillus creber DUCC6004.
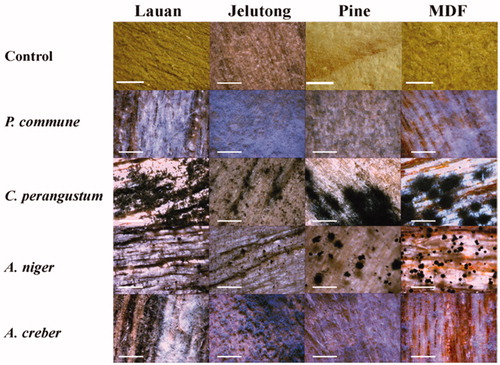
Figure 9. Results of inoculation test on wood chips at 25 °C and 95% humidity condition for 10 days (×45, scale bar = 1 mm). P. commune: Penicillium commune DUCC6000, C. perangustum: Cladosporium perangustum DUCC6005, A. niger: Aspergillus niger DUCC6001, and A. creber: Aspergillus creber DUCC6004.