Figures & data
Table 1. Accession numbers of fungal strains used for the phylogenetic analysis.
Figure 1. Morphological characteristics of Talaromyces halophytorum sp. nov., WLT07. (A,F) Colony on MEA; (B,G) Colony on CYA; (C, H) Colony on YES; (D) Colony on OA; (E) Colony on CREA; (I–J) Conidiophores (scale bar = 10 µm); (K) Conidia (scale bar = 10 µm).
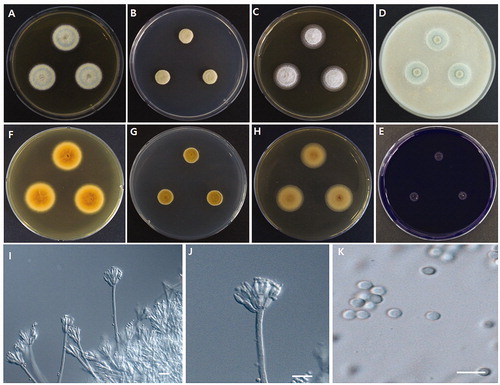
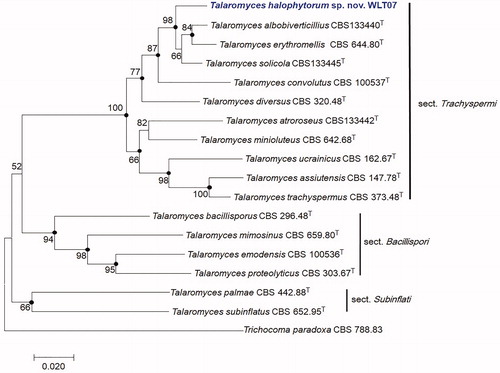
Figure 2. Maximum-likelihood phylogenetic tree based on combined ITS, BenA, CaM, and RPB2 genes of Talaromyces section Trachyspermi species including Talaromyces halophytorum sp. nov., WLT07. Filled circles indicate that corresponding nodes are also recovered in the trees generated with the maximum-parsimony and neighbor joining algorithms. Trichocoma paradoxa was included as an outgroup. Bootstrap analysis was performed with 1000 replications. T indicates the type strain of the species. Bar, 0.02 substitutions per nucleotide position.