Figures & data
Figure 1. Genetic diversity of strains in Trametes. (a) Size of pan-genome (red) and core genome (blue) shared by different genomes, respectively; (b) Core and specific genes families of nine Trametes strains. Number of core genome shared by all strains is in the center (8518). Number of non-overlapping portions of each oval represents the size of specific families; (c) Phylogenetic tree based on the ITS1 sequences of nine Trametes strains and Coriolopsis caperata; (d) Phylogenetic tree based on the ITS2 sequences of nine Trametes strains and C. caperata. Coriolopsis caperata was selected as an outgroup to root the topology of phylogenetic tree; (e) UPGMA tree of Manhattan distance based on the pan-genome composition of nine Trametes strains.
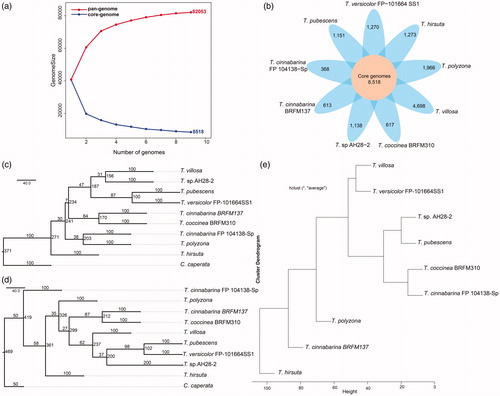
Table 1. Comparison of the genomic features of nine strains in Trametes genus.
Figure 2. COG and GO annotation of gene families. (a) Distribution of COG annotation of pan-genome that assigned in 25 functional categories; (b) Distribution of GO annotation of pan-genome in biological process, molecular function and cellular component. Accessory clusters (pink), core clusters (green), and specific genes (wathet).
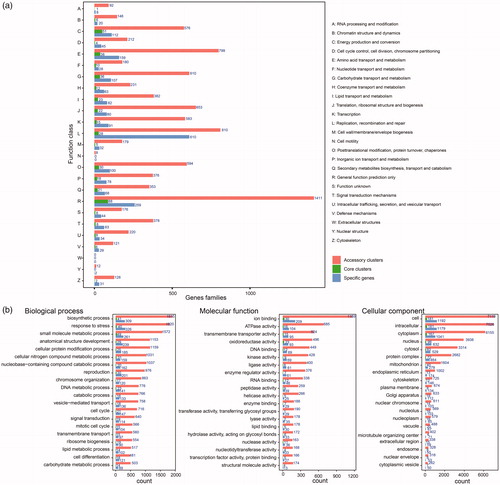
Figure 3. Distributions of CAZymes in nine Trametes strains of Trametes. (a) Distribution of CAZymes in Trametes pan-genome; (b) Distribution of CAZymes of pan-genome in each Trametes strain grouped by accessory clusters, core clusters and specific genes. The numbers shown in subgraph represents the orthologous genes assigned by CAZymes and grouped by accessory clusters (pink), core clusters (green), and specific genes (wathet); (c) Distribution of CAZymes of accessory clusters in each Trametes strain; (d) Distribution of CAZymes of core clusters in each Trametes strain; (e) Distribution of CAZymes of specific genes in each Trametes strain. The numbers shown in subgraphs represent the orthologous genes assigned by CAZymes. GT: glycosyltransferase; GH: glycoside hydrolase; CE: carbohydrate esterase; CBM: carbohydrate-binding molecule; AA: auxiliary activities; PL: polysaccharide lyases.
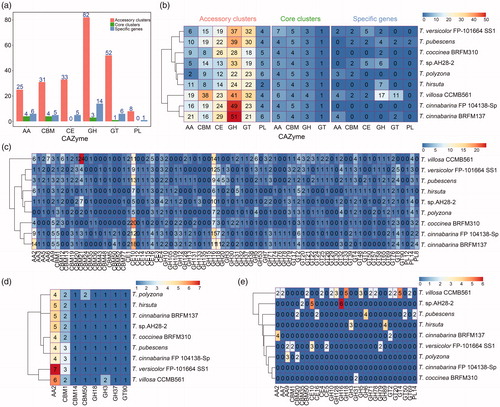
Figure 4. Distribution of biosynthetic gene clusters in nine Trametes strains of Trametes. The distribution of biosynthetic gene clusters in each Trametes strain. The numbers shown in graph represent the counts of different types of biosynthetic gene clusters predicted by antiSMASH for each Trametes strain. Note: cf_putative, putative cluster of unknown type identified with the ClusterFinder algorithm; terpene, terpene cluster; nrps, nonribosomal peptide synthetase cluster; cf_fatty_acid, putative fatty acid cluster identified with the ClusterFinder algorithm; t1pks, type I PKS cluster; lantipeptide, lanthipeptide cluster; other, cluster containing a secondary metabolite-related protein that does not fit into any other category.
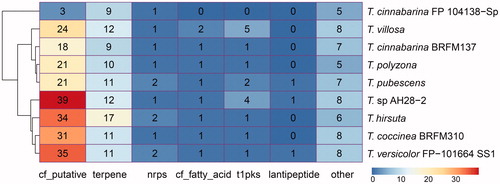
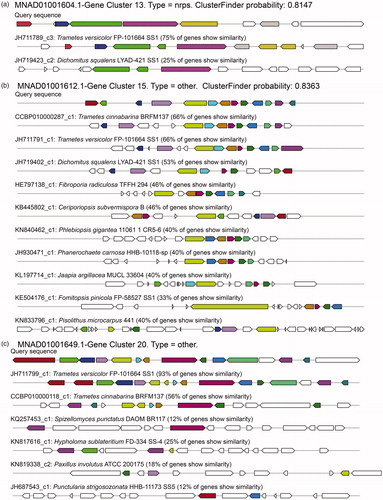
Figure 5. Probability and homologous gene clusters for three putative BGCs of T. pubescens. The probability and homologous gene clusters for the putative BGCs of (a) no. 13; (b) no. 15; (c) no. 20. In the subgraph, the same colors of the boxes with arrows are similar genes.