
Figures & data
Figure 1. Screening of citric acid producing yeasts. (A) Using free cells (F value= 3.518); (B) Using immobilized cells technique (F value = 3.518). Mean ± standard error (n = 3) were presented. Vertical bars indicate the standard errors of the means.
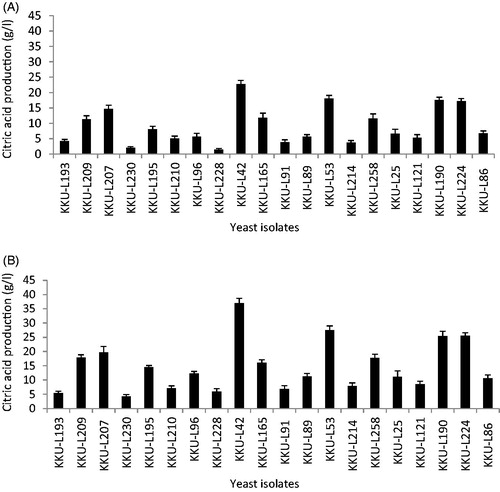
Figure 2. Phylogenetic analyses of the isolates using 26s rRNA gene sequences. (A) KKU-L42; (B) KKU-L53. The scale bar corresponds to a 0.02 nucleotide substitution per sequence position. The number in parentheses represents the accession number in GenBank.
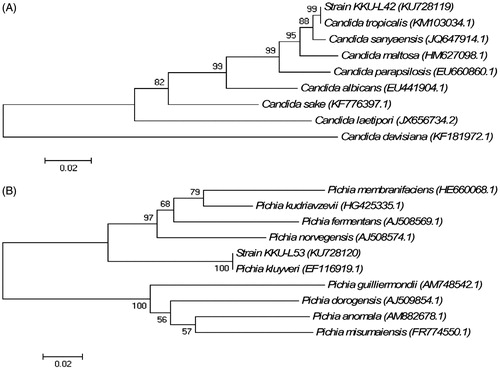
Figure 3. Effect of time course on citric acid production. (A) C. tropicalis) F value = 207.428); (B) P. kluyveri (F value = 173.430). Mean ± standard error (n = 3) were presented. Vertical bars indicate the standard errors of the means.
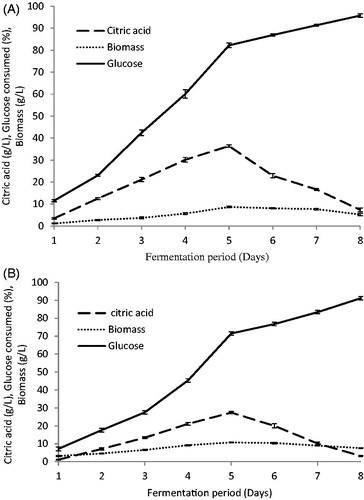
Figure 4. Effect of initial pH on citric acid production. (A) C. tropicalis) F value =266.166); (B) P. kluyveri (F value = 216.574). Mean ± standard error (n = 3) were presented. Vertical bars indicate the standard errors of the means.
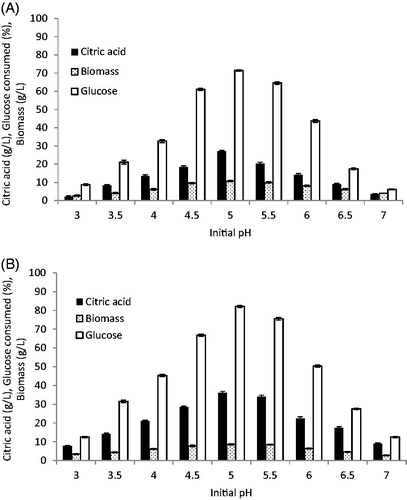
Figure 5. Effect of incubation temperature on citric acid production. (A) C. tropicalis (F-value =198.634); (B) P. kluyveri (F value= 92.764). Mean ± standard error (n = 3) were presented. Vertical bars indicate the standard errors of the means.
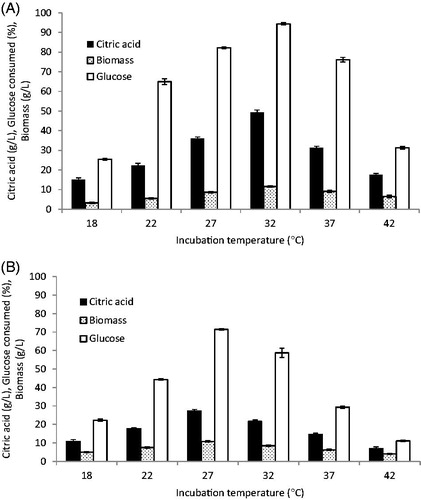
Table 1. Effect of carbon sources on citric acid production by Candida tropicalis (F value = 279.651) and Pichia kluyveri (F value = 85.656).
Table 2. Effect of nitrogen sources on citric acid production by Candida tropicalis (F value= 107.536.) and Pichia kluyveri (F value = 44.401).
Table 3. Repeat batch culture for citric acid production by Candida tropicalis (F value =279.651) and Pichia kluyveri (F value = 374.689).