
Figures & data
Figure 1. Distribution of 77 wild strains of Lentinula edodes in Korea (thin line, river; thick line, mountains).
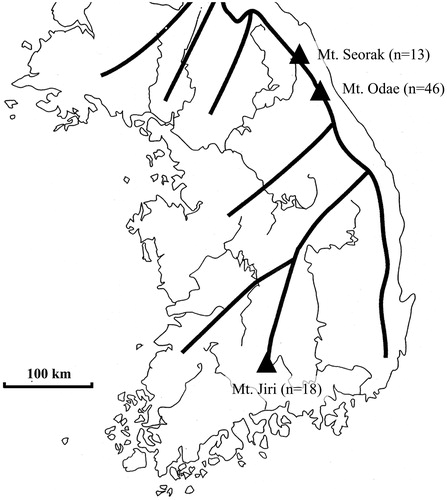
Table 1. Information of SSR markers and diversity statistics for 100 Lentinula edodes strains.
Figure 2. Clustering of distance- and model-based for 100 Lentinula edodes strains including 77 wild strains and 23 cultivars using 20 genomic SSR markers. (A) UPGMA dendrogram based on Nei’s genetic distance; (B) population structure analysis (green, Pop1; red, Pop2; the strains that did not share more than 70% of ancestry were assigned to admixture).
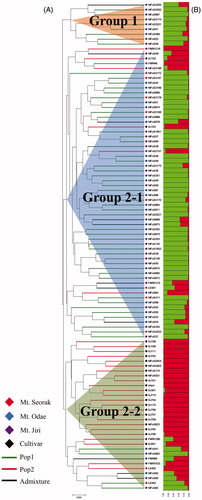
Figure 3. (A) Log probability of the data (LnP(D)) for each K range from 1 to 10; (B) ΔK values calculated as method by Evanno et al. [Citation28].
![Figure 3. (A) Log probability of the data (LnP(D)) for each K range from 1 to 10; (B) ΔK values calculated as method by Evanno et al. [Citation28].](/cms/asset/770efa12-f02a-45c7-a7e1-653436571e40/tmyb_a_1727401_f0003_b.jpg)
Table 2. Diversity statistics as determined by collection regions and types.
Table 3. Analysis of molecular variance (AMOVA) by collection regions and types.