Figures & data
Figure 1. Screening of entomopathogenic fungi against P. brevitarsis. (A) Virulence of different entomopathogenic fungal species and isolates against larvae; (B) Photographs showing P. brevitarsis larva mycosis 7 days after treatment with the highly infective species M. anisopliae JEF-314 compared to non-treated larva; (C) Virulence of the JEF-314 against P. brevitarsis and turfgrass-damaging white coleopteran larvae.
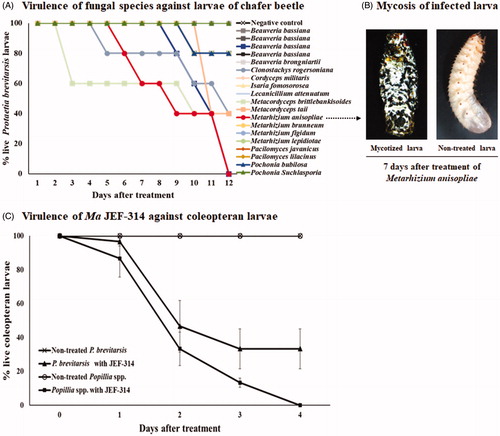
Figure 2. Characterization of the isolate JEF-314 of M. anisopliae. (A) Morphological characterization of the JEF-314 isolate: M. anisopliae cultured 14 days at 25 °C on a one-quarter strength SDA plate and Microscopic observation of the 14 days cultured fungus under a stereoscopic microscope (×40); 5 days conidiogenesis and 7 days conidia microphotographs under the optical microscope, respectively (×400); (B) Phylogenetic trees of the isolate JEF-314 and other Metarhizium isolates based on ITS and beta-tubulin sequences. Evolutionary distance was calculated for aligned sequences by Maximum Likelihood analyses.
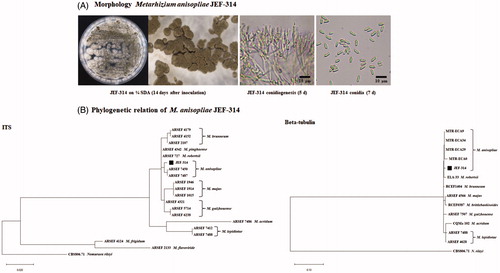
Figure 3. Stage-dependent virulence of M. anisopliae JEF-314 against Protaetia brevitarsis seulensis. (A) Percentage of hatching eggs following infection with JEF-314. a and b denote significant differences; (B–D) Survival curves of first, second and third instar larvae infected with JEF-314, respectively; a and b denote statistically significant differences and * and ** refers to p < 0.05 and p < 0.001 respectively; (E) Survival curve of infected adults. The photographs in the various graphs show the infection symptoms of the different development stages of the insect caused by M. anisopliae JEF-314 compared to non-infected eggs or larvae, 7 days after treatment, as well as the puparium formed by pupae (F). In the case of treated eggs, we show the mycosis of the freshly hatched larva from the infected egg.
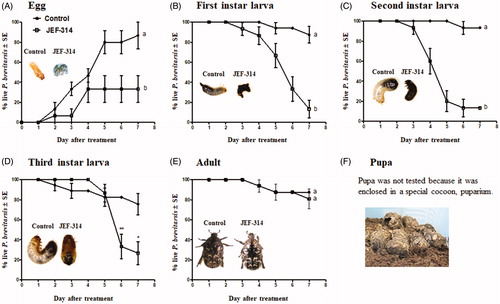
Figure 4. Efficacy of different quantities of the fungi granules against the dwelling second instar larvae of the flower chafer beetle. (A) Experimental procedure for the employed assay; (B) Survival curves of larvae treated with different quantities of the granule-based formulation.
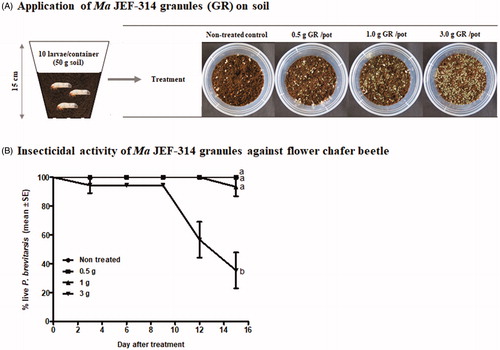
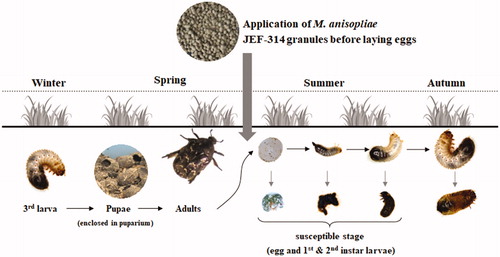
Figure 5. Suggested model for application of the isolate M. anisopliae JEF-314 in the field to control the flower chafer beetle.