
Figures & data
Table 1. Geographic information of three representative wetlands in the Korea peninsula.
Figure 1. Location of each wetland in the Korean Peninsula. Site 1: Mt. Gariwang’s primeval forest wetlands (37°25′58"N, 128°33′48"E, 620 m); Site 2, Is. Jangdo wetlands (34°40'41.1"N, 25°22'15.4"E, height above sea level 169 m); and Site 3, Hanbando geology wetland (37°13'5"N, 128°20'56"E, 280 m).
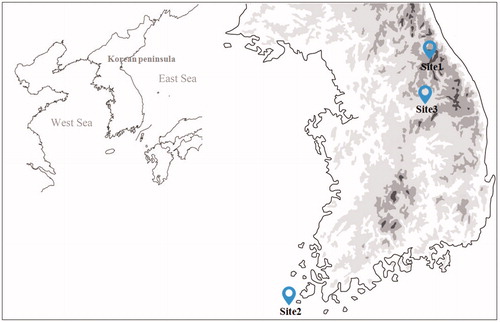
Table 2. Results of soil analysis.
Figure 2. Rarefaction curves for operational taxonomic units (OTUs) from each site. OTUs were clustered at 3% dissimilarity using CD-HIT. Curves indicate microbial community diversity in the Mt. Gariwang’s primeval forest wetlands (green, OTUs, 169; sequencing reads, 236,624), the Is. Jangdo wetlands (purple, OTUs, 283; sequencing reads, 157,649), and the Hanbando geology wetlands (red, OTUs, 145; sequencing reads, 179,870).
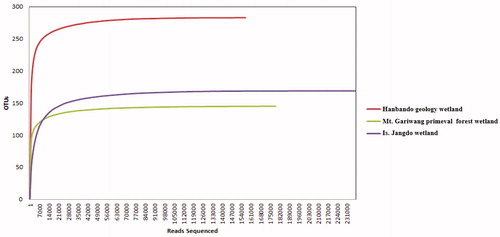
Table 3. Pyrosequencing results and statistical analyses of fungal clusters in each wetlands.
Table 4. Fungal phylum composition of each wetlands.
Figure 3. Fungal phyla distribution from each wetland (unit: %). Variance of phyla ratio was characteristic, and the uniqueness of fungal taxa could be expected.
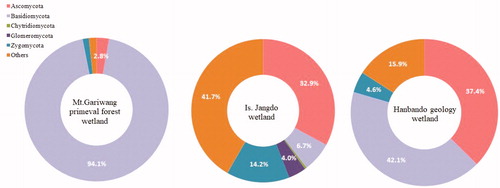
Figure 4. Fungal diversity defined by Shannon, Simpson’s, and Chao richness indices. Variance of genera diversity was characteristic, and the Is. Jangdo wetlands showed higher evenness, diversity, and dominance of fungal genera. These results corroborate the variation of identified or unique genera.
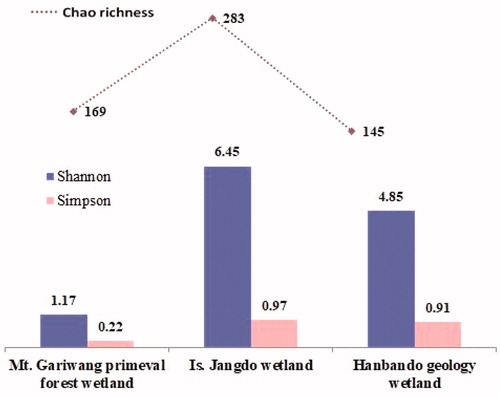
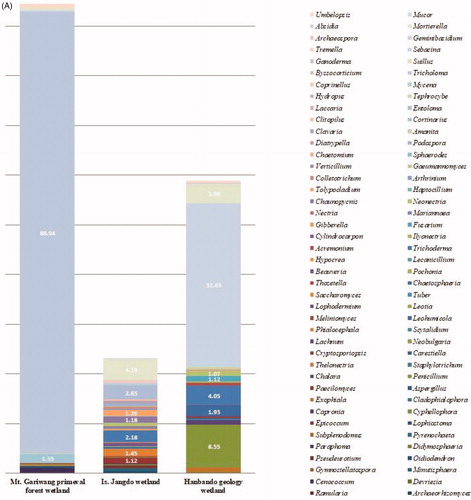
Table 5. Fungal genera distributions in each wetland.
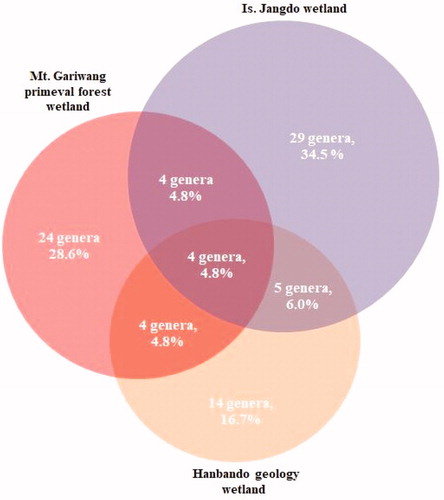
Figure 6. Uniqueness of fungal genera distributions in total microbiome samples. Wetlands sharing similar fungal taxa are below 6%, but uniquely distributed taxa were highly confirmed, especially in the Is. Jangdo wetlands. Percentages represent the proportion of unique or shared taxa.
Data availability statement
All the raw sequences obtained from this study have been deposited at the NCBI Sequence Read Archive (SRA metadata) under the project PRJNA616032 with sample accession numbers of SAMN14479947 (Mt. Gariwang’s primeval forest wetland), SAMN14479948 (Is. Jangdo wetland), and SAMN1447994 (Hanbando geology wetland).