Figures & data
Table 1. Information of Oomycetes specimens used in this study.
Figure 1. Maximum likelihood trees of Plasmopara species based on the LSU ribosomal DNA (D1/D2/D3) sequences (A) and the cox2 mitochondrial DNA sequences (B), with support values in minimum evolution inference. Bootstraping support values (minimum evolution/maximum likelihood) higher than 60% are given above the branches. The scale bar equals the number of nucleotide substitutions per site.
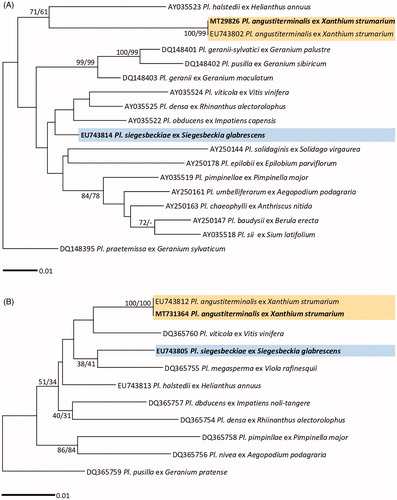
Table 2. Genbank accession numbers of the ITS, 28S rDNA, and cox2 mtDNA sequences used for the phylogenetic study.
Figure 2. Maximum likelihood trees of Peronospora species based on the internal transcribed spacer (ITS) sequences (A) and the cox2 mitochondrial DNA sequences (B), with support values in minimum evolution inference. Bootstraping support values (minimum evolution/maximum likelihood) higher than 60% are given above the branches. The scale bar equals the number of nucleotide substitutions per site.
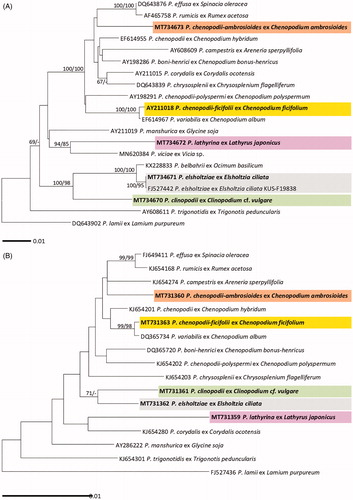
Figure 3. Morphological characteristics of two Plasmopara species, Pl. angustiterminalis ex Xanthium strumarium (A–E) and Pl. siegesbeckiae ex Siegesbeckia glabrescens (F–J). (A & F), Sporangiophores; (B, C, G, H), Ultimate branchlets; (D, E, I, J), Sporangia (scale bars: 100 µm for sporangiophores, 10 µm for ultimate branchlets, and 10 µm for sporangia).
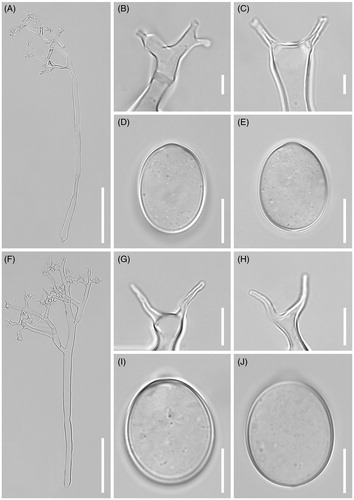
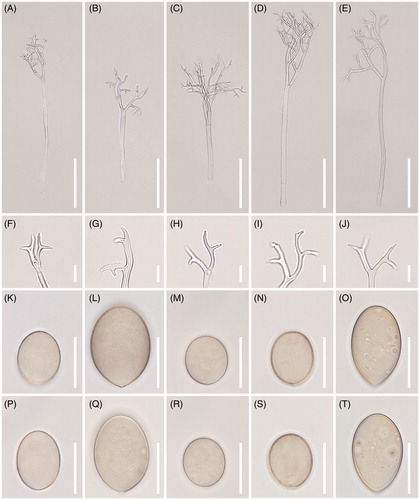
Figure 4. Morphological characteristics of five Peronospora species, P. chenopodii-ambrosioidis ex Chenopodium ambrosioides (A, F, K, P), P. chenopodii-ficifolii ex Chenopodium ficifolium (B, G, L, Q), P. clinopodii ex Clinopodium cf. vulgare (C, H, M, R), P. elsholtziae ex Elsholtzia ciliata (D, I, N, S), and P. lathyirna ex Lathyrus japonicus (E, J, O, T). (A–E), Conidiophores; (F–J), Ultimate branchlets; (K–T), Conidia (scale bars: 100 µm for conidiophores, 10 µm for ultimate branchlets, and 20 µm for conidia).