
Figures & data
Table 1. Expression of proteolysis-associated genes in mice liver by single (SOA) or multiple oral (MOA) BGF administrations.
Figure 1. Real-time PCR of corin mRNA expression in mice tissues. (A) ICR mice (n = 4) were orally administered zymosan, barley β-glucan, and BGF at 100 mg/kg for seven consecutive days. RT-PCR analysis of corin was performed on the mRNAs of mice liver and kidney tissues. (B) RT-PCR analysis of corin was performed on the kidney tissue of ICR mice treated with β-glucans from Phellinus baumii, Phellinus linteus, and Ganoderma lucidum at 100 mg/kg for seven consecutive days. CON: control; ZYM: β-glucan of yeast zymosan A from Saccharomyces cerevisiae; BAR: β-glucan of barley; BGF: β-glucan fraction of carpophores of Phellinus baumii. The values are expressed as the average ± SD. *p < 0.01, **p < 0.005.
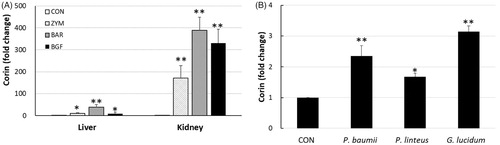
Figure 2. Effects of β-glucans on the production of ANP in various mice tissues. ICR mice (n = 6) were orally administered zymosan, barley β-glucan, and BGF at 100 mg/kg/day for seven consecutive days. ANP peptides were extracted from the heart, kidney, and liver of mice with protein extraction kit solution by lysing with a bead-beater homogenizer. The ANP concentrations were determined by an ELISA kit for mouse ANP by measuring the OD450 with a spectrophotometer. CON: control; ZYM: β-glucan of yeast zymosan A from Saccharomyces cerevisiae; BAR: β-glucan of barley; BGF: β-glucan fraction of carpophores of Phellinus baumii. The values are expressed as the average ± SD. *p < 0.01.
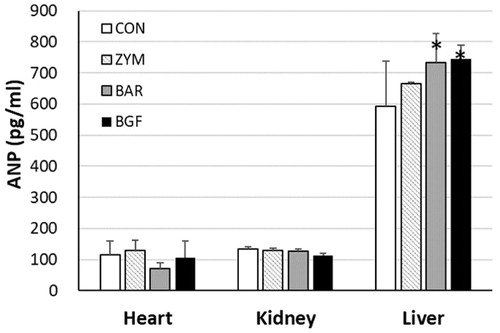
Figure 3. Effects of orally administered β-glucans on changes in body weight and food and water intakes in high-salt diet-fed mice. ICR mice (n = 4) kept in metabolic cages and were orally administered zymosan, barley β-glucan, and BGF at 100 mg/kg/day for seven consecutive days. Mouse body weight (A), food (B) and water (C) intakes were measured daily. CON: control; ZYM: β-glucan of yeast zymosan A from Saccharomyces cerevisiae; BAR: β-glucan of barley; BGF: β-glucan fraction of carpophores of Phellinus baumii. The values are expressed as the average ± SD.
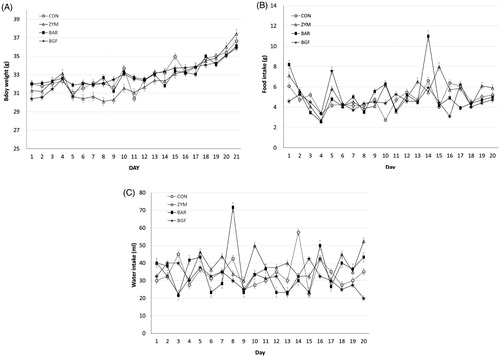
Figure 4. Effect of orally administered β-glucan on sodium excretion in normal-salt-fed mice. β-Glucans of zymosan, barley, and BGF were orally administered at 100 mg/kg/day to ICR mouse (n = 4) for eight days by feeding with normal-salt diet. (A) Urinary sodium excretion in mice fed a normal-salt diet for eight days. (B) Average urinary sodium excretion in mice fed a normal-salt diet for eight days. The values are expressed as the average ± SE. *p < 0.01, **p < 0.005.
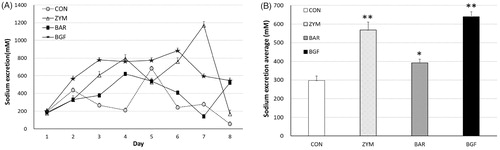
Figure 5. Effect of orally administered β-glucan on sodium excretion in high-salt-fed mice. β-Glucans of zymosan, barley, and BGF were orally administered at a concentration of 100 mg/kg/day to ICR mouse (n = 4) for 21 days by feeding with high-salt diet. (A) Sodium excretion in urine of high-salt fed mice for 21 days; (B) Average sodium excretion in urine of high-salt fed mice for 21 days. Values are average ± SE. *p < 0.01, **p < 0.005.
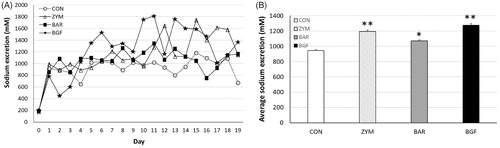
Figure 6. Proposed corin enzyme induced antihypertension mechanism of β-glucan. Oral administration of β-glucan induced corin in the liver or kidney, which cleaves pro-ANP into biologically active atrial natriuretic peptide (ANP) and N-terminal peptide (NTP). Upon the binding of ANP to its receptor, signals of the receptor promote natriuresis, diuresis, and vasodilation, which lower blood volume and pressure. Corin, a trypsin-like serine protease, induced by β-glucan, acts at the beginning of the ANP pathway to regulate the salt-water balance and blood pressure. The finding of ANP-initiated cGMP vasodilation was reported elsewhere [Citation32]. AAs: amino acids; ANP: atrial natriuretic peptide; NTP: N-terminal peptide.
![Figure 6. Proposed corin enzyme induced antihypertension mechanism of β-glucan. Oral administration of β-glucan induced corin in the liver or kidney, which cleaves pro-ANP into biologically active atrial natriuretic peptide (ANP) and N-terminal peptide (NTP). Upon the binding of ANP to its receptor, signals of the receptor promote natriuresis, diuresis, and vasodilation, which lower blood volume and pressure. Corin, a trypsin-like serine protease, induced by β-glucan, acts at the beginning of the ANP pathway to regulate the salt-water balance and blood pressure. The finding of ANP-initiated cGMP vasodilation was reported elsewhere [Citation32]. AAs: amino acids; ANP: atrial natriuretic peptide; NTP: N-terminal peptide.](/cms/asset/9457cd38-a42d-468e-87de-65b78d9c8122/tmyb_a_1812150_f0006_c.jpg)