Figures & data
Figure 1. Plum pocket of plum and sexual stage of Taphrina deformans. (A) Deformed plum fruits; (B) Deformed fruits inoculated with T. deformans yeast cells; (C) Asci; (D) Ascospores.
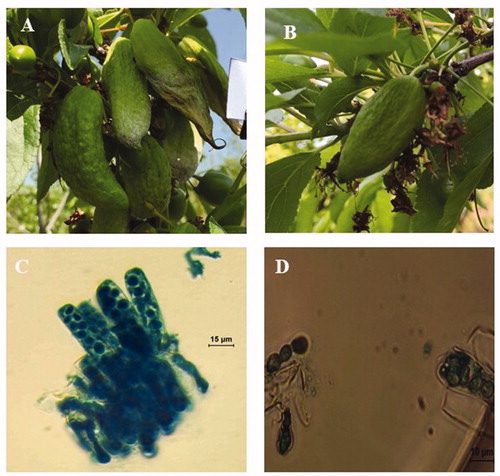
Figure 2. Yeast stage of Taphrina deformans on potato dextrose agar plates. (A) Obverse colony; (B) Reverse side of the colony; (C) Yeast cells; (D) Budding yeast cells and pseudo mycelium.
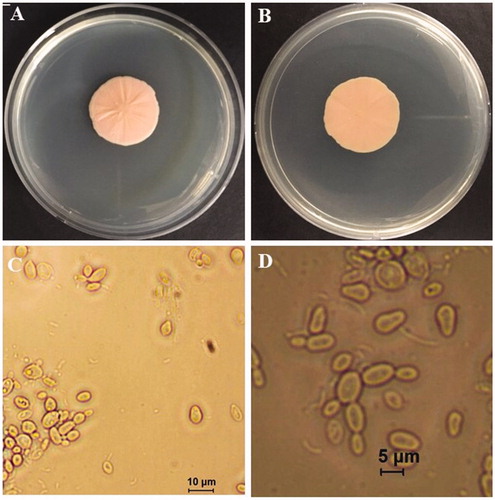
Figure 3. Effect of culture media on colony growth of Taphrina deformans at 20. (A) Potato dextrose agar; (B) Oat meal agar; (C) Malt extract agar; (D) V8 juice agar; (E) Corn meal agar. Different letter on bar indicate that mean are significantly different (p<.05) according to Fisher’s LSD test.
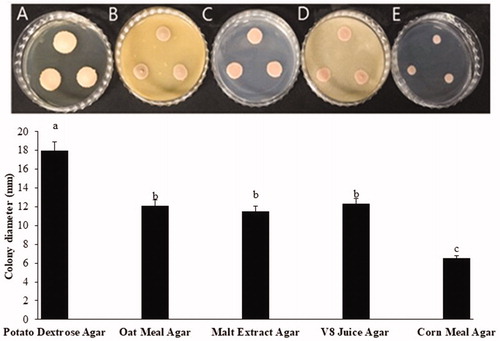
Figure 4. Effect of temperature on colony growth of Taphrina deformans on potato dextrose agar.
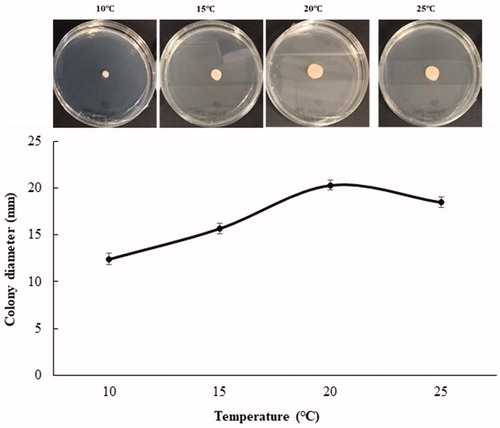
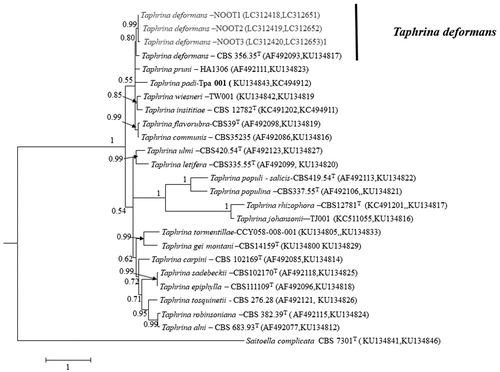
Figure 5. Bayesian phylogeny (BI) based on a 50% majority rule consensus tree showing phylogenetic relationships based on the combined ITS and SSU DNA sequence alignment among the present isolates and Taphrina spp. The BI posterior probability (>0.5) are given at the nodes. The scale bar shows the number of substitutions per site. T, ex type strain.