Figures & data
Table 1. List of species used in this study and their GenBank accession numbers for phylogenetic analysis.
Figure 1. Cultural and morphological characteristics of 17E-042. (A) Colonies were grown on potato dextrose agar; (B) Malt extract agar; (C) Oatmeal agar at 25 °C for 7 days, reverse and obverse side view, respectively. (D) Colonies on oatmeal agar; (E–G) Conidiogenous cells give rise to conidia; (H–J) Sterile cells; (K–L) Conidia. Scale bars: E–L = 10 μm.
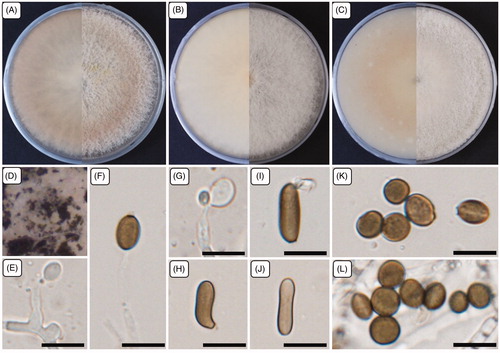
Table 2. Morphological comparison, habitat, and origin of Arthrinium minutisporum sp. nov. with the closest species of Arthrinium.
Figure 2. Neighbor-joining phylogenetic tree of 17E-042 based on combined sequences data (ITS+TUB2+TEF1) showing the relationship between Arthrinium minutisporum sp. nov., and the closest Arthrinium spp. The tree was rooted using Seiridium phylicae CPC 19965 as an outgroup. The numbers above the branches represent the bootstrap values (ML/MP/NJ) obtained for 1000 replicates (values smaller than 50% were not shown). The isolated strain of this study is indicated in bold. Bar, 0.02 substitutions per nucleotide position.
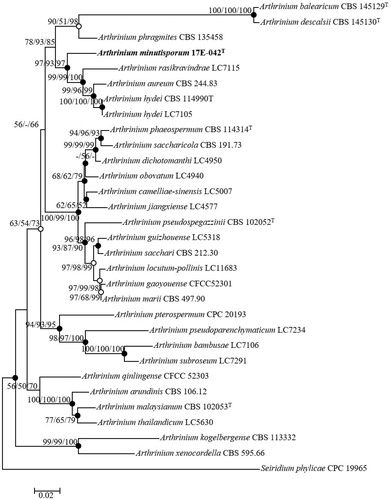
Figure 3. Cultural and morphological characteristics of 17E-039. (A) Colonies were grown on potato dextrose agar; (B) Malt extract agar; (C) Oatmeal agar at 25 °C for 14 days, reverse and obverse side view, respectively. (D–F) Conidiomata forming on oatmeal agar; (G) Macroconidiogenous cells; (H) Microconidiogenous cells; (I–K) Macroconidia; (L, M) Microconidia. Arrows indicate microconidiogenous cells. Scale bars: D–F = 500 μm; G–M = 10 μm.
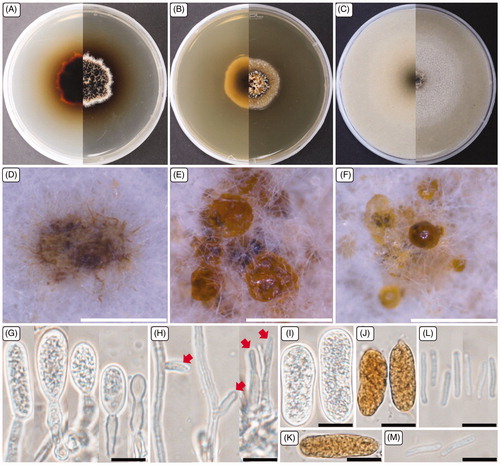
Table 3. Morphological characteristics of the strain 17E-039 with reference to Pezicula neosporulosa.
Figure 4. Neighbor-joining phylogenetic tree of 17E-039 based on combined sequences data (ITS + LSU+RPB2) showing the relationships between P. neosporulosa and the closest Pezicula spp. The tree was rooted using Rhizodermea veluwensis CBS 110605T as an outgroup. The numbers above the branches represent the bootstrap values (ML/MP/NJ) obtained for 1000 replicates (values smaller than 60% were not shown). The isolated strain of this study is indicated in bold. Bar, 0.01 substitutions per nucleotide position.
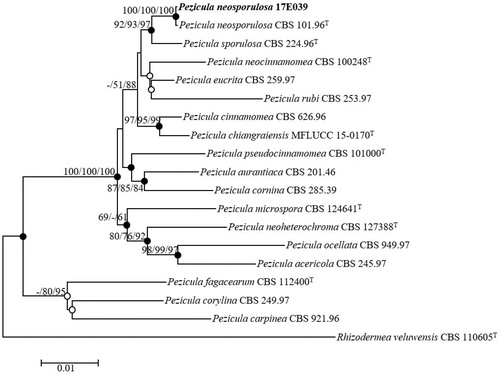
Figure 5. Cultural and morphological characteristics of NC13-171. (A) Colony on potato dextrose agar; (B) Malt extract agar; (C) Oatmeal agar at 25 °C in 14 days, reverse and obverse side view, respectively. (D) Structures formed in culture; (E–G) Chlamydospores. Scale bars: D = 500 μm; E–G = 10 μm.
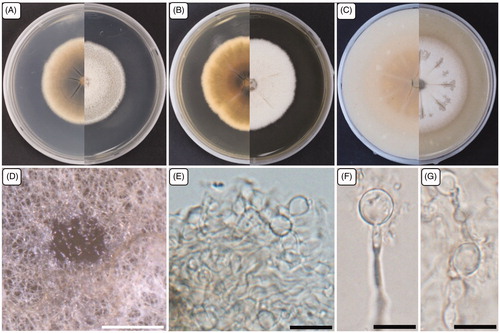
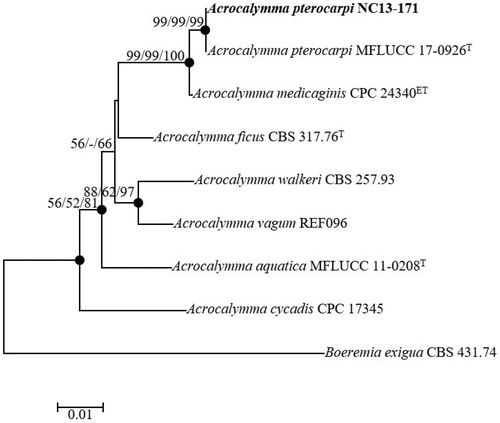
Figure 6. Neighbor-joining phylogenetic tree based on the concatenated ITS region and partial of 28S rDNA sequences showing the phylogenetic position of Acrocalymma pterocarpi NC13-171 among members of the genus Acrocalymma. The tree was rooted using Boeremia exigua CBS 431.74 as an outgroup. The numbers above the branches represent the bootstrap values (ML/MP/NJ) obtained for 1000 replicates (values smaller than 50% were not shown). The isolated strain of this study is indicated in bold. Bar, 0.01 substitutions per nucleotide position.