Figures & data
Figure 1. Body weight change during the experiment. Mice were fed with vehicle (G1), 100 mg/kg of red ginseng (G2), or 50, 150, and 300 mg/kg of CMEE (C3–C5) for 12 weeks. Data were expressed as mean ± S.D. (n = 10 mice in each group). *p < 0.05, compared with normal control (G1).
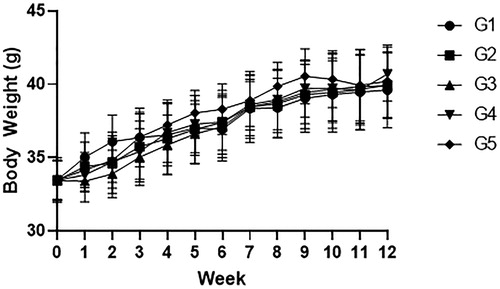
Table 1. Effect of CMEE on grip strength (gf, grams of force).
Figure 2. Serum biochemical analysis results of the muscle fatigue related biomarkers. Mice were fed with vehicle (G1), 100 mg/kg of red ginseng (G2), or 50, 150, and 300 mg/kg of CMEE (C3–C5) for 12 weeks. Data are expressed as mean ± S.D. (n = 10 mice in each group). ***p < 0.001, **p < 0.01, *p < 0.05, compared with normal control (G1).
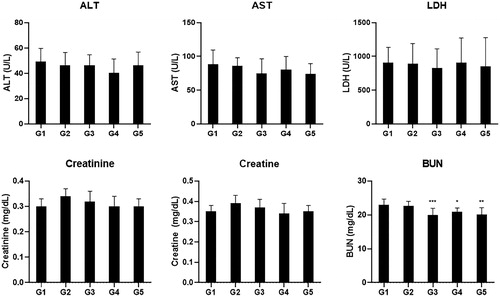
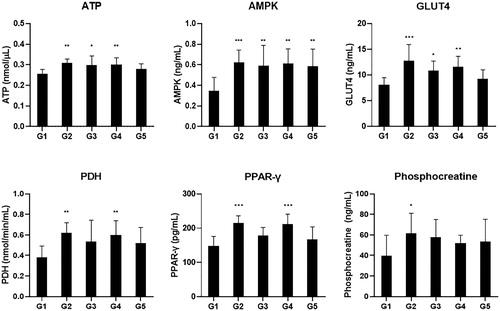
Figure 3. ELISA analysis results of the energy production related biomarkers. Mice were fed with vehicle (G1), 100 mg/kg of red ginseng (G2), or 50, 150, and 300 mg/kg of CMEE (C3–C5) for 12 weeks. Data are expressed as mean ± S.D. (n = 10 mice in each group). ***p < 0.001, **p < 0.01, *p < 0.05, compared with normal control (G1).