Figures & data
Table 1. Sequences used in this study and GenBank accession numbers.
Figure 1. Phylogenetic tree of Acremonium guillematii CNUFC YJW2-22 and CNUFC YJW2-22-1, and related species, based on a maximum likelihood analyses of internal transcribed spacer (A) and large subunit (B) sequences. The sequence of Plectosphaerella cucumerina was used as an outgroup. Bootstrap support values of ≥50% are indicated at the nodes. Ex-type strains are indicated by T.
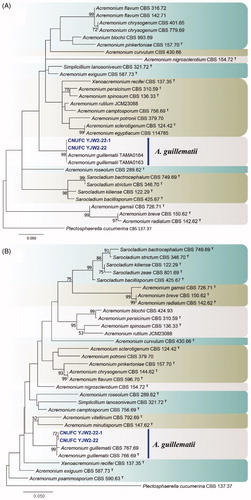
Figure 2. Phylogenetic tree of Cadophora novi-eboraci CNUFC MSW11-6-2 and CNUFC MSW11-6-2-1, and related species, based on maximum likelihood analyses of internal transcribed spacer (A) and beta-tubulin (B) sequences. The sequence of Cadophora finlandica was used as an outgroup. Bootstrap support values of ≥50% are indicated at the nodes. Ex-type strains are indicated by T.
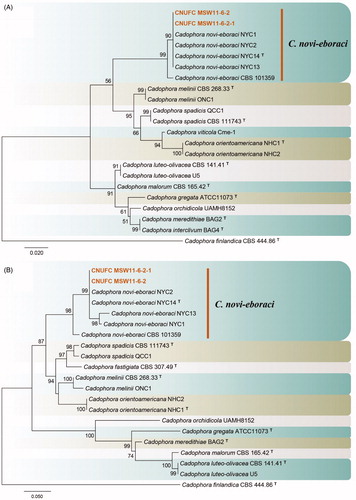
Figure 3. Phylogenetic tree of Lectera nordwiniana CNUFC HRS5-3 and CNUFC HRS5-3-1, and related species, based on maximum-likelihood analyses of internal transcribed spacer (A) and large subunit (B) sequences. The sequence of Monilochaetes melastomae was used as an outgroup. Bootstrap support values of ≥50% are indicated at the nodes. Ex-type and ex-neotype strains are indicated by T and NT.
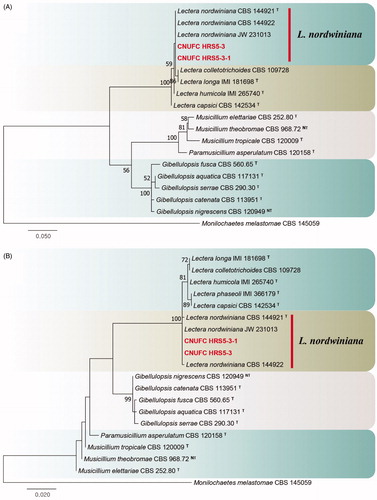
Figure 4. Phylogenetic tree of Mycoarthris corallina CNUFC MSW242-6 and CNUFC MSW242-8, and related species, based on maximum-likelihood analysis of internal transcribed spacer sequences. The sequences of Monilinia laxa and Sclerotinia sclerotiorum were used as outgroups. Bootstrap support values of ≥50% are indicated at the nodes. Ex-type strains are indicated by T.
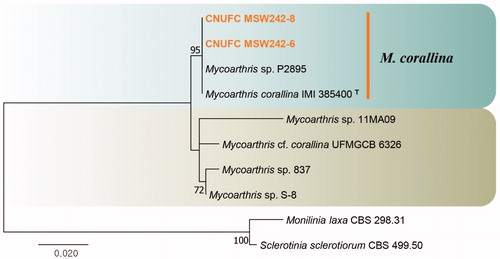
Figure 5. Phylogenetic tree of Talaromyces siamensis CNUFC DMW2-2 and CNUFC DMW2-2-1, and related species, based on maximum-likelihood analyses of internal transcribed spacer, beta-tubulin, and calmodulin sequences. The sequence of Talaromyces dendriticus was used as an outgroup. Bootstrap support values of ≥50% are indicated at the nodes. Ex-type strains are indicated by T.
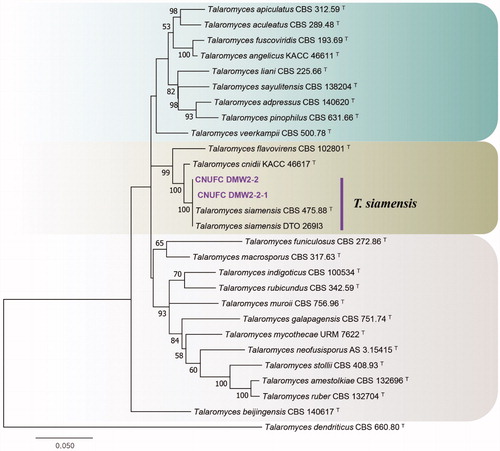
Figure 6. Phylogenetic tree of Tetracladium globosum CNUFC CPWS-1 and CNUFC CPWS-2, and related species, based on maximum-likelihood analysis of internal transcribed spacer sequences. The sequence of Botryotinia fuckeliana was used as an outgroup. Bootstrap support values of ≥50% are indicated at the nodes. Ex-type strains are indicated by T.
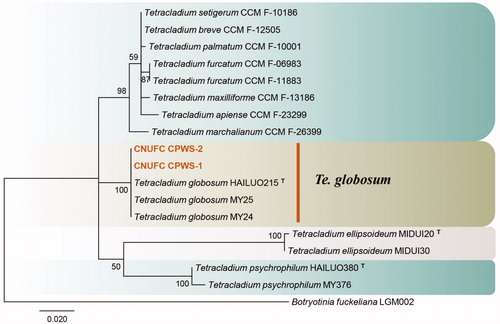
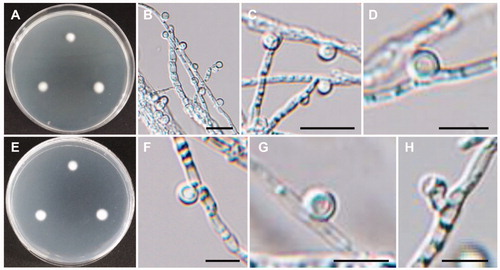
Figure 7. Morphology of Acremonium guillematii CNUFC YJW2-22. (A,D) Colonies on potato dextrose agar. (B,E) Colonies on malt extract agar. (C,F) Colonies on oatmeal agar. (A–C) obverse view, (D–F) reverse view. (G,H) Branched conidiophores. (I,J) Conidiophores and clustered conidia in slimy heads. (K) Octahedral crystals in culture. (L) Conidia. Scale bars: G-K = 20 µm, L = 10 µm.
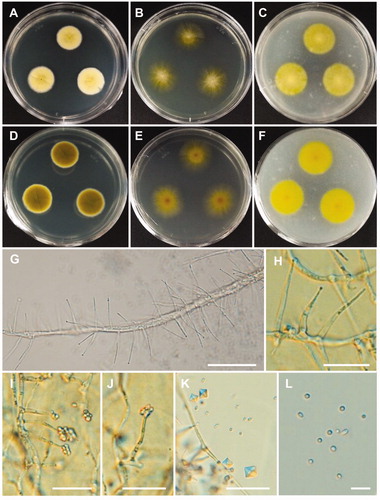
Figure 8. Morphology of Cadophora novi-eboraci CNUFC MSW11-6-2. (A,D) Colonies on potato dextrose agar. (B,E) Colonies on malt extract agar. (C,F) Colonies on oatmeal agar. (A–C) obverse view, (D–F) reverse view. (G–I) Conidiogenous cells and conidia in slimy heads. (J) Conidia. Scale bars: G-J = 10 µm.
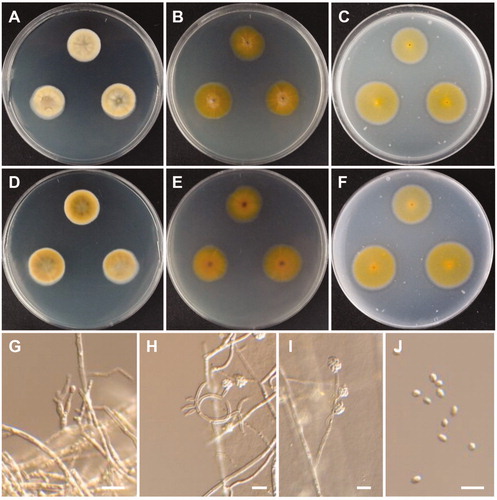
Figure 9. Morphology of Lectera nordwiniana CNUFC HRS5-3. (A,D) Colonies on potato dextrose agar. (B,E) Colonies on malt extract agar. (C,F) Colonies on oatmeal agar. (A–C) obverse view, (D–F) reverse view. (G) Young conidiomata on potato dextrose agar. (H,I) Conidiomata with setae. (J) Apex of a seta. (K,L) Phialides with conidia on acervuli. (M) Conidia. Scale bars: G = 1 mm, H = 200 µm, I = 20 µm, J-M = 10 µm.
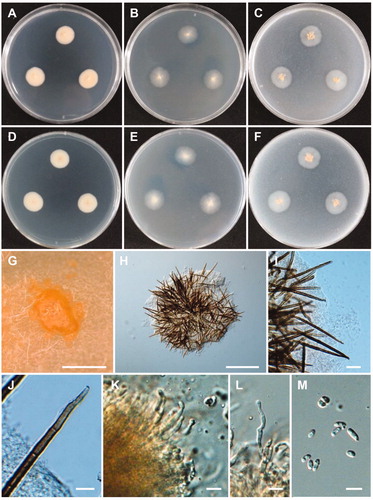
Figure 10. Morphology of Mycoarthris corallina CNUFC MSW242-6. (A,D) Colonies on potato dextrose agar. (B,E) Colonies on malt extract agar. (C,F) Colonies on oatmeal agar. (A–C) obverse view, (D–F) reverse view. (G) Anastomosing hyphae (white arrows). (H) Conidiophore. (I) Chain of arthroconidia. (J) Conidia. Scale bars: G-J = 20 µm.
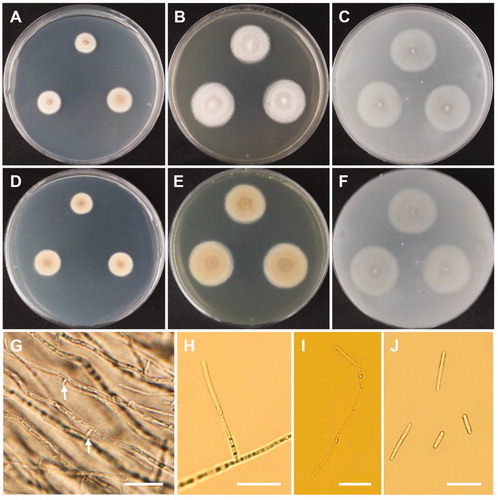
Figure 11. Morphology of Talaromyces siamensis CNUFC DMW2-2. (A,D) Colonies on czapek yeast autolysate agar. (B,E) Colonies on yeast extract sucrose agar. (C,F) Colonies on malt extract agar. (A–C) obverse view, (D–F) reverse view. (G–J) Conidiophores. (K) Conidia. Scale bars: G-J = 20 µm, K = 10 µm.
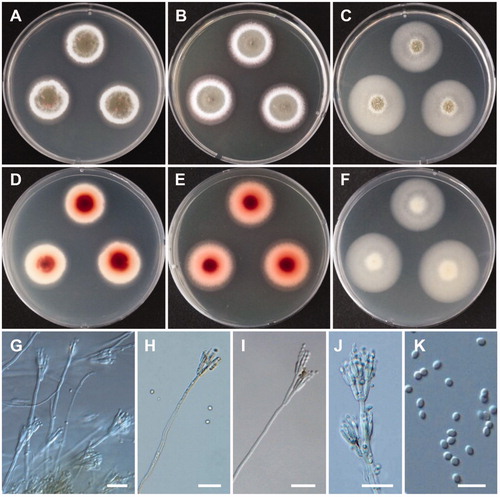
Figure 12. Morphology of Tetracladium globosum CNUFC CPWS-1. (A,E) Colonies on potato dextrose agar. (A) obverse view, (E) reverse view. (B–D) Conidia and hyphae. (F–H) Conidia. Scale bars: B-C = 20 µm, D, F-H = 10 µm.