Figures & data
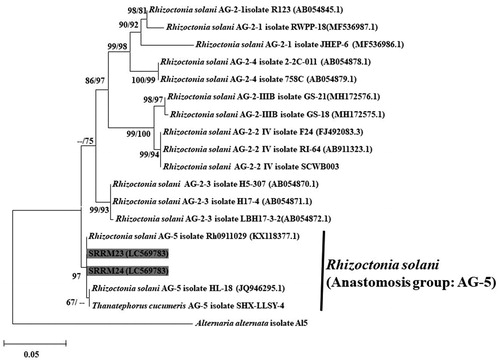
Figure 1. Damping-off of ovate-leaf atractylodes. (A–B) Symptoms as seen in the field. (C) Symptoms of seedlings inoculated with Rhizoctonia solani AG-5. (D) Healthy seedlings without inoculation.
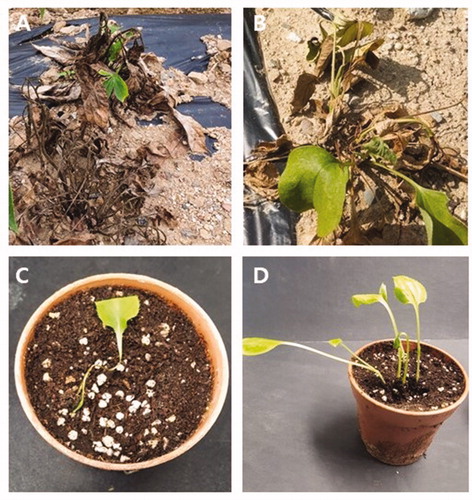
Figure 2. Microscopic and macroscopic characteristics of Rhizoctonia solani. (A–B) Colony with dark brown sclerotia grown on PDA. (C) Right-angle branching of septate hyphae. (D) Monilioid cells of sclerotia. (E–F) Hyphal anastomosis between a R. solani isolate for anastomosis group designation.
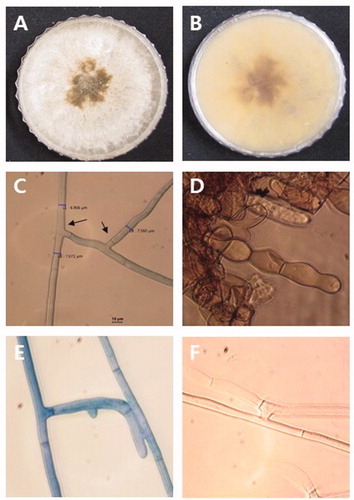
Figure 3. A maximum likelihood tree illustrating estimates of phylogenetic relationship of the Korean and the reference isolates of Rhizoctonia solani. Alternaria alternata isolate Al5 was used as an outgroup. Bootstrap support values ≥50% are presented at the nodes (ML/NJ). The scale bar indicates the number of nucleotide substitutions.